Alarm.com Holdings, Inc. ALRM
Alarm.com is the leading platform for intelligently connected properties. 10-K, Item 1
- Employees
- 2,058
- Headquarters
- Tysons, VA
- CEO
- Stephen Trundle
- Next results
- around Feb 18, 2027
Where each dollar of revenue went, FY2025
Revenue of $1.0B through the costs to a net profit of $132.6M · income statement of the 10-K
ALRM among Technology peers
Six ratios from the latest 10-K. Each corner is the share of 230 peers the company is above, not a score.
What changed
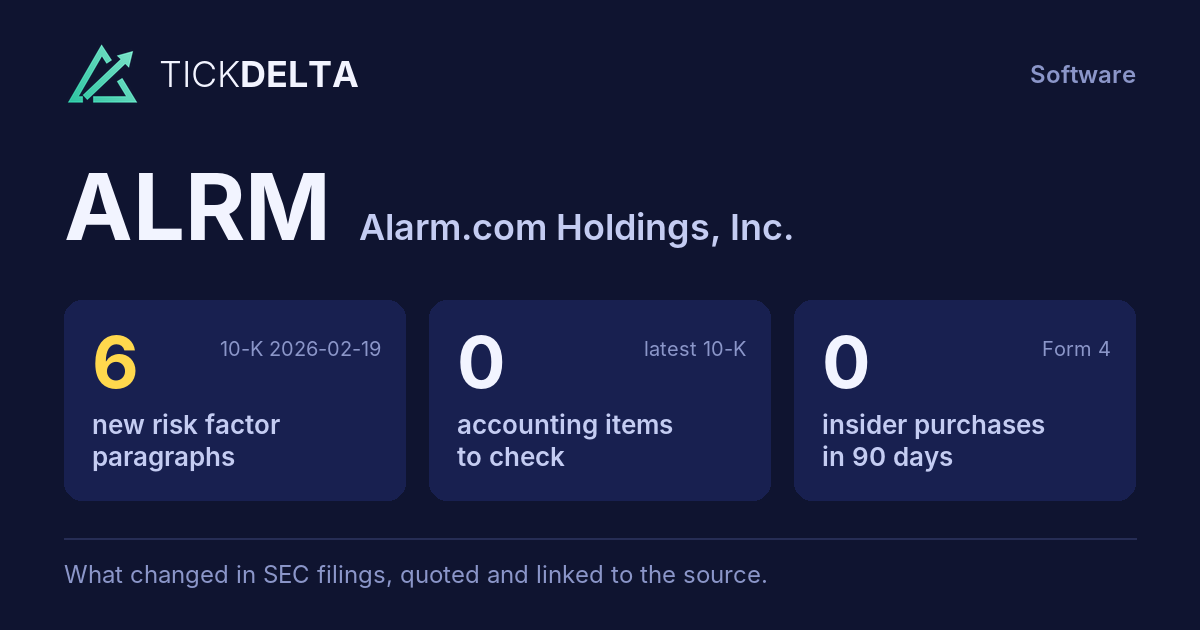
6 new risk paragraphs. 10-K filed Feb 19, 2026 against Feb 20, 2025.
Each row opens the detail with the quote and the filing. A row is a change worth reading, not a verdict.
Accounting checks
11 checks on the latest 10-K. Checks, not verdicts.
0facts worth reading about all 11 checks found nothing to note
-
Receivables +12.5% ($126.1M to $141.9M) vs revenue +7.6% ($939.8M to $1.0B), +4.9 pts apart
-
Cash from operations $153.3M vs net income $131.6M (FY ending Dec 31, 2025)
-
Inventory +8.0% ($87.4M to $94.4M) vs revenue +7.6% ($939.8M to $1.0B), +0.4 pts apart
8 more checks with nothing to note
-
Same auditor in both 10-Ks: PricewaterhouseCoopers LLP
-
No statement of substantial doubt about going concern
-
No 8-K item 4.02 in the last 2 years
-
No NT 10-K or NT 10-Q in the last 2 years
-
The same matters as last year: Revenue recognition
-
No sentence in the 10-K concludes that controls were not effective because of a material weakness
-
No 8-K item 2.06 in the last 2 years
-
No 8-K item 1.03 in the last 2 years
In their words
6 paragraphs in Risk Factors that were not in the 10-K filed Feb 20, 2025. Quoted as filed.
-
Item 1A · new paragraph · not in the 10-K filed Feb 20, 2025 10-K, ITEM 1A
In April 2025, the U.S. government announced a baseline tariff of 10% on all products imported into the United States (with certain limited exceptions) and additional individualized tariffs based on country of origin at different rates per country. Certain of these tariffs have been subsequently paused or modified, and the situation…
-
Item 1A · new paragraph · not in the 10-K filed Feb 20, 2025 10-K, ITEM 1A
Our business, operations and service provider partners are subject to various U.S. federal, state and local consumer protection laws, licensing regulation and other laws and regulations, and to similar laws and regulations in the other countries in which we operate. Our advertising and sales practices and that of our U.S. service…
-
Item 1A · new paragraph · not in the 10-K filed Feb 20, 2025 10-K, ITEM 1A
In addition, because certain of our products require government certification before they can be sold, our business could be harmed by delays in obtaining these certifications. For instance, the U.S. government shutdown that occurred during part of the fourth quarter of 2025 significantly limited the FCC’s ability to approve new…
-
Item 1A · new paragraph · not in the 10-K filed Feb 20, 2025 10-K, ITEM 1A
Our hardware products depend on the availability and quality of components that we procure from third-party suppliers, some of which are supplied by single or limited source suppliers. Reliance on suppliers generally involves several risks, including volatile pricing, the possibility of defective parts, and loss of a supplier due to…
New risk paragraphs, against peers
Latest 10-K of each, Technology companies closest in revenue
Paragraphs in Risk Factors with nothing like them in the company's 10-K the year before. A count of text, not of risk.
Financial performance
Last 4 fiscal years · 10-K XBRL
| Metric | FY2022 | FY2023 | FY2024 | FY2025 |
|---|---|---|---|---|
| Revenue | $842.6M | $881.7M | $939.8M | $1.0B |
| Net income | $56.3M | $81.0M | $124.1M | $132.6M |
| Operating cash flow | $56.9M | $136.0M | $206.4M | $153.3M |
| Free cash flow | $28.3M | $128.4M | $196.3M | $137.0M |
Revenue, FY2016 to FY2025
Ten fiscal years, each from its own 10-K · XBRL · USD
$1.0B ▲ 7.6% in FY2025$132.6M ▲ 6.8% in FY2025$137.0M ▼ 30.2% in FY2025
Recent filings
3 filings in the last 30 days · SEC EDGAR
-
Planned saleNov 10, 2026DON CLARKE (Director) gave notice of a planned sale of 4,624 shares worth about $300K Form 144, approximate sale date Nov 10, 2026
-
8-KNov 5, 2026Quarterly results 8-K item 2.02
-
10-QNov 5, 2026Quarterly report (10-Q) period ended Sep 30, 2026
About the company
Alarm.com Holdings, Inc., Tysons, VA · from the 10-K filed Feb 19, 2026
Alarm.com is the leading platform for intelligently connected properties. Our cloud-based platform offers an expansive suite of Internet of Things, or IoT, solutions addressing global opportunities in the residential, multi-family, small business, enterprise commercial and energy markets. Alarm.com’s solution suite includes security, video surveillance and video analytics, energy management, access control, electric utility grid management, active shooter detection, water management, personal safety and data-rich emergency response. During 2025, our platforms processed more than 365 billion data points generated by over 170 million connected devices.
- Headquarters
- Tysons, VA
- Country
- United States
- Reports in
- USD
- Listed on
- Nasdaq
- Fiscal year ends
- December 31
- Last results
- Nov 5, 2026
- Incorporated in
- DE
Employees, at the top of the page: "As of December 31, 2025, we had 2,058 full-time employees, including 607 in sales and marketing, 1,150 in research and development, 235 in a general and administrative capacity and 66 who manufacture hardware for our suite of IoT solutions" (10-K). Address and exchange: SEC's company file.
Email alerts
Sources
The 10-K filed Feb 19, 2026 (open at SEC), compared with the 10-K filed Feb 20, 2025. Numbers from the XBRL of the 10-Ks; filings from SEC EDGAR.
Work with it: Excel workbook · CSV. Google Sheet that stays up to date: paste =IMPORTDATA("https://tickdelta.com/company/ALRM/export.csv") into a cell.