Lantheus Holdings, Inc. LNTH
We are the leading radiopharmaceutical-focused company committed to enabling clinicians to Find, Fight and Follow disease to deliver better patient outcomes. 10-K, Item 1
- Employees
- 1,193
- Headquarters
- Bedford, MA
- CEO
- Mary Anne Heino
- Next results
- around Feb 25, 2027
Where each dollar of revenue went, FY2025
Revenue of $1.5B through the costs to a net profit of $233.6M · income statement of the 10-K
LNTH among Health care peers
Six ratios from the latest 10-K. Each corner is the share of 154 peers the company is above, not a score.
What changed
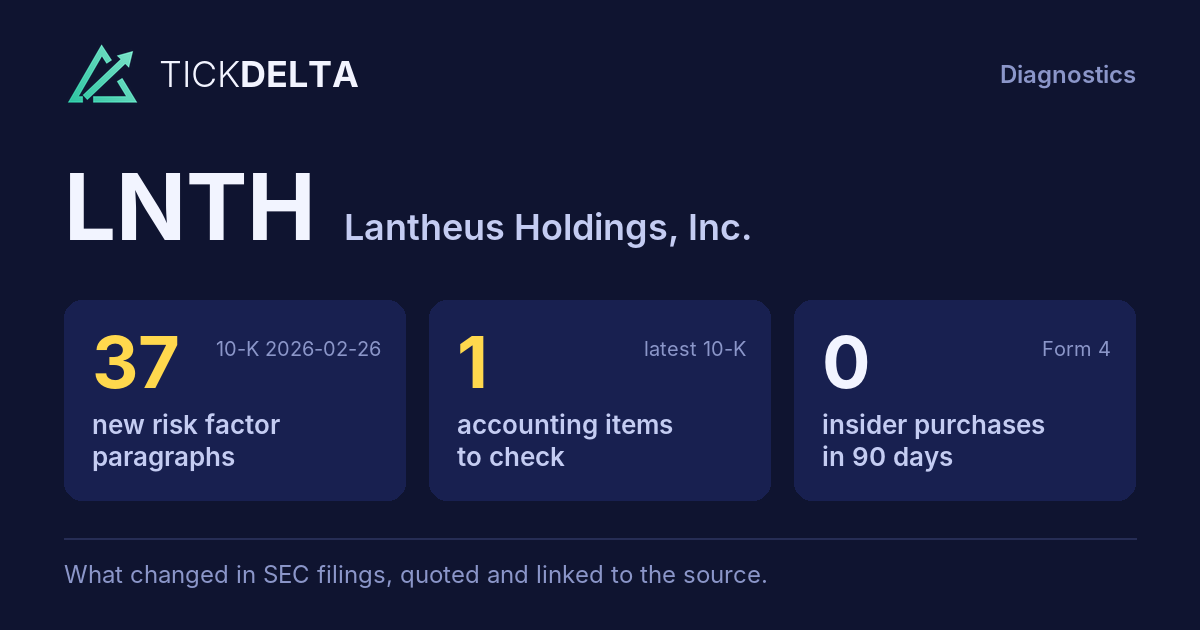
37 new risk paragraphs and 1 accounting fact worth reading about. 10-K filed Feb 26, 2026 against Feb 26, 2025.
Each row opens the detail with the quote and the filing. A row is a change worth reading, not a verdict.
Accounting checks
11 checks on the latest 10-K. Checks, not verdicts.
1fact worth reading about the other 10 checks found nothing to note
-
Receivables growing faster than revenueReceivables +11.6% ($321.3M to $358.6M) vs revenue +0.5% ($1.5B to $1.5B), +11.1 pts apart
-
Cash from operations $390.1M vs net income $233.6M (FY ending Dec 31, 2025)
9 more checks with nothing to note
-
Inventory -4.9% ($68.0M to $64.7M) vs revenue +0.5% ($1.5B to $1.5B), -5.4 pts apart
-
Same auditor in both 10-Ks: Deloitte & Touche LLP
-
No statement of substantial doubt about going concern
-
No 8-K item 4.02 in the last 2 years
-
No NT 10-K or NT 10-Q in the last 2 years
-
The same matters as last year: Revenue
-
No sentence in the 10-K concludes that controls were not effective because of a material weakness
-
No 8-K item 2.06 in the last 2 years
-
No 8-K item 1.03 in the last 2 years
In their words
37 paragraphs in Risk Factors that were not in the 10-K filed Feb 26, 2025. Quoted as filed.
-
Item 1A · new paragraph · not in the 10-K filed Feb 26, 2025 10-K, ITEM 1A
Following the expiration of regulatory exclusivity, we may face increased competition from generic products, including through abbreviated approval pathways under the Hatch‑Waxman Act or as a result of actions brought under the CREATES Act. The likelihood of entry or anticipated entry of such competing products cannot be predicted and…
-
Item 1A · new paragraph · not in the 10-K filed Feb 26, 2025 10-K, ITEM 1A
Our ability to grow Neuraceq is dependent on (A) our ability to engage our existing PYLARIFY customers to introduce Neuraceq to those customers, (B) expanded geographical access to Neuraceq, which in turn depends on our ability to increase Neuraceq manufacturing capacity at existing manufacturing sites and add additional sites, (C)…
-
Item 1A · new paragraph · not in the 10-K filed Feb 26, 2025 10-K, ITEM 1A
Ensuring adequate coding, coverage, and payment for Neuraceq is critical, including not only coverage from Medicare, Medicaid and other government payors, as well as private payors, but also appropriate payment levels to adequately cover our customers’ costs of using Neuraceq in PET/ CT imaging procedures. Neuraceq was approved by the…
-
Item 1A · new paragraph · not in the 10-K filed Feb 26, 2025 10-K, ITEM 1A
In addition, in order to remain competitive, in certain circumstances, we provide customers with rebates, which we estimate as a reduction to revenue at the time revenue is recognized. Judgment is required in making these estimates. These rebates can include performance-based offers that are based on attaining contractually specified…
New risk paragraphs, against peers
Latest 10-K of each, Health care companies closest in revenue
Paragraphs in Risk Factors with nothing like them in the company's 10-K the year before. A count of text, not of risk.
Financial performance
Last 4 fiscal years · 10-K XBRL
| Metric | FY2022 | FY2023 | FY2024 | FY2025 |
|---|---|---|---|---|
| Revenue | $935.1M | $1.3B | $1.5B | $1.5B |
| Net income | $28.1M | $326.7M | $312.4M | $233.6M |
| Operating cash flow | $281.8M | $305.3M | $544.8M | $390.1M |
| Free cash flow | $21.8M | $259.9M |
Revenue, FY2016 to FY2025
Ten fiscal years, each from its own 10-K · XBRL · USD
$1.5B ▲ 0.5% in FY2025$233.6M ▼ 25.2% in FY2025
Recent filings
4 filings in the last 30 days · SEC EDGAR
-
8-KNov 10, 2026Other events 8-K item 8.01
-
8-KNov 5, 2026Quarterly results 8-K item 2.02
-
10-QNov 5, 2026Quarterly report (10-Q) period ended Sep 30, 2026
-
8-KOct 22, 2026Other events 8-K item 8.01
About the company
Lantheus Holdings, Inc., Bedford, MA · from the 10-K filed Feb 26, 2026
We are the leading radiopharmaceutical-focused company committed to enabling clinicians to Find, Fight and Follow disease to deliver better patient outcomes. We classify our products into three product categories: Radiopharmaceutical Oncology, Precision Diagnostics, and Strategic Partnerships and Other Revenue. Our Radiopharmaceutical Oncology product helps healthcare professionals (“HCPs”) Find, Fight and Follow cancer. Our Precision Diagnostic products assist HCPs to Find and Follow diseases.
- Headquarters
- Bedford, MA
- Country
- United States
- Reports in
- USD
- Listed on
- Nasdaq
- Fiscal year ends
- December 31
- Last results
- Nov 5, 2026
- Incorporated in
- DE
Employees, at the top of the page: "As of December 31, 2025, we had 1,193 employees, of which 1,056 were located in the United States and 137 were located internationally" (10-K). Address and exchange: SEC's company file.
Email alerts
Sources
The 10-K filed Feb 26, 2026 (open at SEC), compared with the 10-K filed Feb 26, 2025. Numbers from the XBRL of the 10-Ks; filings from SEC EDGAR.
Work with it: Excel workbook · CSV. Google Sheet that stays up to date: paste =IMPORTDATA("https://tickdelta.com/company/LNTH/export.csv") into a cell.