Paylocity Holding Corp PCTY
We are a leading cloud-based provider of human capital management (“HCM”), finance and IT software solutions. 10-K, Item 1
- Headquarters
- Schaumburg, IL
- CEO
- Toby J. Williams
- Next results
- around Feb 4, 2027
Where each dollar of revenue went, FY2026
Revenue of $1.8B through the costs to a net profit of $269.7M · income statement of the 10-K
PCTY among Technology peers
Six ratios from the latest 10-K. Each corner is the share of 230 peers the company is above, not a score.
What changed
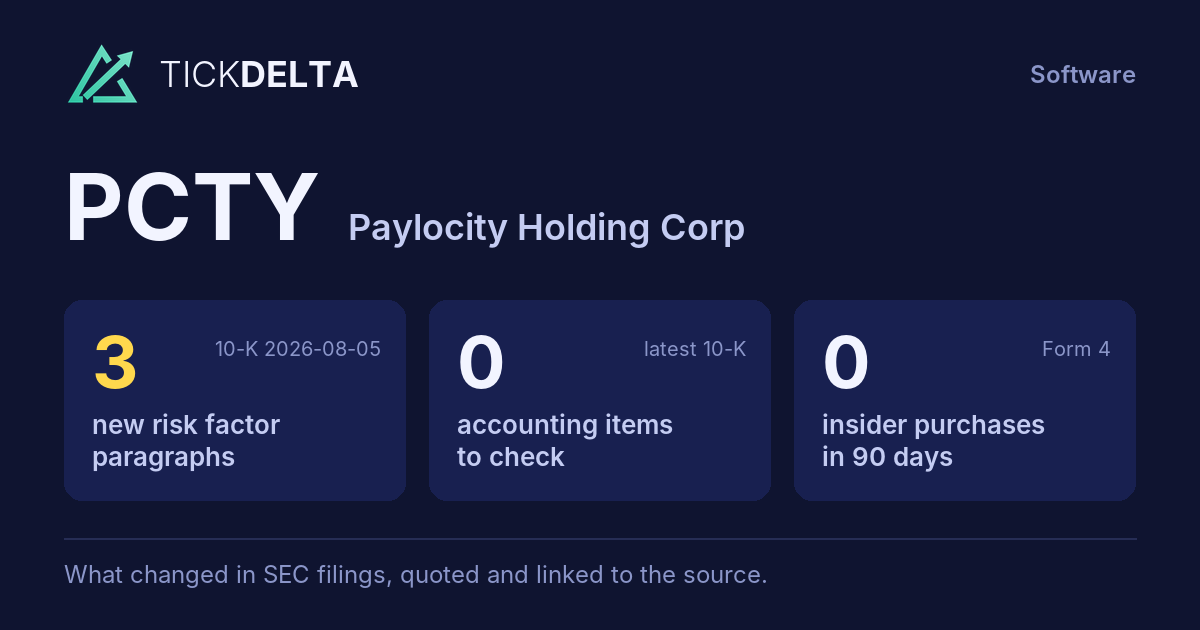
3 new risk paragraphs. 10-K filed Aug 5, 2026 against Aug 6, 2025.
Each row opens the detail with the quote and the filing. A row is a change worth reading, not a verdict.
Accounting checks
10 checks on the latest 10-K. Checks, not verdicts.
0facts worth reading about all 10 checks found nothing to note
-
Receivables +20.3% ($41.6M to $50.1M) vs revenue +11.0% ($1.6B to $1.8B), +9.3 pts apart
-
Cash from operations $533.3M vs net income $269.7M (FY ending Jun 30, 2026)
-
Same auditor in both 10-Ks: KPMG LLP
7 more checks with nothing to note
-
No statement of substantial doubt about going concern
-
No 8-K item 4.02 in the last 2 years
-
No NT 10-K or NT 10-Q in the last 2 years
-
No longer listed: Fair value of proprietary technology intangible asset. Same as last year: Capitalized internal-use software development costs
-
No sentence in the 10-K concludes that controls were not effective because of a material weakness
-
No 8-K item 2.06 in the last 2 years
-
No 8-K item 1.03 in the last 2 years
In their words
3 paragraphs in Risk Factors that were not in the 10-K filed Aug 6, 2025. Quoted as filed.
-
Item 1A · new paragraph · not in the 10-K filed Aug 6, 2025 10-K, ITEM 1A
Several of our competitors are larger and have greater name recognition, longer operating histories and significantly greater resources than we do. Many of these competitors are able to devote greater resources to the
New risk paragraphs, against peers
Latest 10-K of each, Technology companies closest in revenue
Paragraphs in Risk Factors with nothing like them in the company's 10-K the year before. A count of text, not of risk.
Financial performance
Last 4 fiscal years · 10-K XBRL
| Metric | FY2023 | FY2024 | FY2025 | FY2026 |
|---|---|---|---|---|
| Revenue | $1.2B | $1.4B | $1.6B | $1.8B |
| Net income | $140.8M | $206.8M | $227.1M | $269.7M |
| Operating cash flow | $282.7M | $384.7M | $418.2M | $533.3M |
| Free cash flow | $260.8M | $366.6M | $405.2M | $497.1M |
Revenue, FY2017 to FY2026
Ten fiscal years, each from its own 10-K · XBRL · USD
$1.8B ▲ 11.0% in FY2026$269.7M ▲ 18.8% in FY2026$497.1M ▲ 22.7% in FY2026
Recent filings
8 filings in the last 30 days · SEC EDGAR
-
Planned saleNov 6, 2026Andrew Cappotelli (Senior Vice President of Operations and Chief Client Officer) adopted a 10b5-1 trading plan reported in the 10-Q, up to 23,175 shares, runs to Nov 19, 2027
-
Planned saleNov 6, 2026Nicholas Rost (Vice President Chief Accounting Officer and Treasurer) adopted a 10b5-1 trading plan reported in the 10-Q, up to 4,740 shares, runs to Aug 23, 2027
-
Planned saleNov 6, 2026Ryan Glenn (Chief Financial Officer) adopted a 10b5-1 trading plan reported in the 10-Q, up to 27,855 shares, runs to Nov 22, 2027
-
Planned saleNov 6, 2026Joshua Scutt (Senior Vice President of Sales and Marketing and Chief Sales Officer) adopted a 10b5-1 trading plan reported in the 10-Q, up to 22,565 shares, runs to Aug 25, 2027
-
Planned saleNov 6, 2026Melissa King (Senior Vice President of Product and Technology and Chief Product and Technology Officer) adopted a 10b5-1 trading plan reported in the 10-Q, up to 20,742 shares, runs to Aug 23, 2027
About the company
Paylocity Holding Corp, Schaumburg, IL · from the 10-K filed Aug 5, 2026
We are a leading cloud-based provider of human capital management (“HCM”), finance and IT software solutions. Our unified, easy-to-use platform helps businesses streamline HR, finance, and IT operations, manage spend and talent, and build culture and connection with artificial intelligence (“AI”) embedded directly into everyday workflows to save time, reduce manual effort, and support better decision-making. Excluding clients acquired through acquisitions, as of June 30, 2026, we provided our software-as-a-service (“SaaS”) solutions to approximately 44,400 clients across the U.S., which on average had over 150 employees.
- Headquarters
- Schaumburg, IL
- Country
- United States
- Reports in
- USD
- Listed on
- Nasdaq
- Fiscal year ends
- June 30
- Last results
- Nov 5, 2026
- Incorporated in
- DE
Email alerts
Sources
The 10-K filed Aug 5, 2026 (open at SEC), compared with the 10-K filed Aug 6, 2025. Numbers from the XBRL of the 10-Ks; filings from SEC EDGAR.
Work with it: Excel workbook · CSV. Google Sheet that stays up to date: paste =IMPORTDATA("https://tickdelta.com/company/PCTY/export.csv") into a cell.