Trade Desk, Inc. TTD
We are a global leader in advertising technology. 10-K, Item 1
- Employees
- 3,843
- Headquarters
- Ventura, CA
- CEO
- Jeffrey Terry Green
- Next results
- around Jan 25, 2027
Where each dollar of revenue went, FY2025
Revenue of $2.9B through the costs to a net profit of $443.3M · income statement of the 10-K
TTD among Technology peers
Six ratios from the latest 10-K. Each corner is the share of 230 peers the company is above, not a score.
What changed
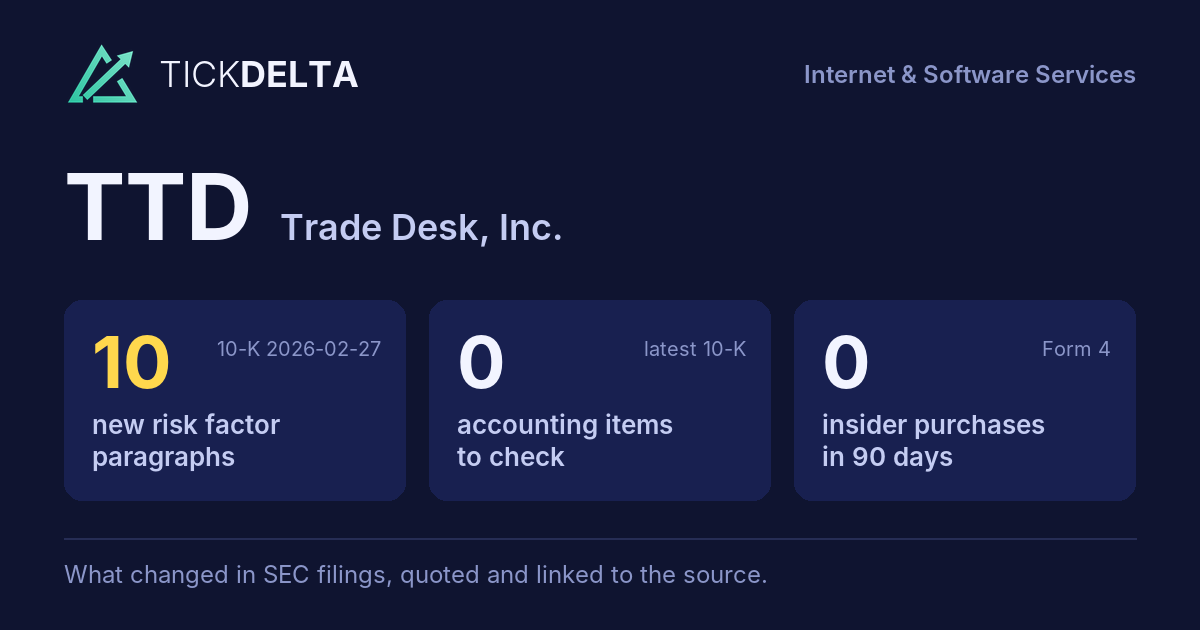
10 new risk paragraphs. 10-K filed Feb 27, 2026 against Feb 21, 2025.
Each row opens the detail with the quote and the filing. A row is a change worth reading, not a verdict.
Accounting checks
10 checks on the latest 10-K. Checks, not verdicts.
0facts worth reading about all 10 checks found nothing to note
-
Receivables +13.2% ($3.3B to $3.8B) vs revenue +18.5% ($2.4B to $2.9B), -5.3 pts apart
-
Cash from operations $992.7M vs net income $443.3M (FY ending Dec 31, 2025)
-
Same auditor in both 10-Ks: PricewaterhouseCoopers LLP
7 more checks with nothing to note
-
No statement of substantial doubt about going concern
-
No 8-K item 4.02 in the last 2 years
-
No NT 10-K or NT 10-Q in the last 2 years
-
The same matters as last year: Revenue Recognition
-
No sentence in the 10-K concludes that controls were not effective because of a material weakness
-
No 8-K item 2.06 in the last 2 years
-
No 8-K item 1.03 in the last 2 years
In their words
10 paragraphs in Risk Factors that were not in the 10-K filed Feb 21, 2025. Quoted as filed.
-
Item 1A · new paragraph · not in the 10-K filed Feb 21, 2025 10-K, ITEM 1A
To sustain or increase our revenue, we must regularly add new clients and encourage existing clients to maintain or increase the amount of spend through our platform and adopt existing or new offerings that we make available. If competitors introduce lower cost or differentiated offerings that compete with or are perceived to compete…
-
Item 1A · new paragraph · not in the 10-K filed Feb 21, 2025 10-K, ITEM 1A
Historically, some of our competitors have sought to differentiate themselves to prospective customers primarily on the basis of artificially low prices, which are enabled by inherent conflicts of interest and a lack of objectivity, and do not account for the overall value delivered to customers. Our future success depends upon our…
-
Item 1A · new paragraph · not in the 10-K filed Feb 21, 2025 10-K, ITEM 1A
Increasingly, state laws require companies like ours to honor opt outs expressed through device-based preference signals, such as the Global Privacy Control (“GPC”), which enable consumers to opt out of relevant activities by all data controllers at once rather than individually. California and other state regulators announced an…
-
Item 1A · new paragraph · not in the 10-K filed Feb 21, 2025 10-K, ITEM 1A
Evolving industry standards regarding impression counts and related disputes and customer collections could impact our business and reputation. In 2025, the global digital advertising ecosystem saw a large increase in supply (ad impression opportunities). Supply growth has meaningfully outpaced demand growth. Overall, we believe this is…
New risk paragraphs, against peers
Latest 10-K of each, Technology companies closest in revenue
Paragraphs in Risk Factors with nothing like them in the company's 10-K the year before. A count of text, not of risk.
Financial performance
Last 4 fiscal years · 10-K XBRL
| Metric | FY2022 | FY2023 | FY2024 | FY2025 |
|---|---|---|---|---|
| Revenue | $1.6B | $1.9B | $2.4B | $2.9B |
| Net income | $53.4M | $178.9M | $393.1M | $443.3M |
| Operating cash flow | $548.7M | $598.3M | $739.5M | $992.7M |
| Free cash flow | $464.6M | $551.5M | $641.2M | $795.7M |
Revenue, FY2016 to FY2025
Ten fiscal years, each from its own 10-K · XBRL · USD
$2.9B ▲ 18.5% in FY2025$443.3M ▲ 12.8% in FY2025$795.7M ▲ 24.1% in FY2025
Recent filings
4 filings in the last 30 days · SEC EDGAR
-
Planned saleNov 12, 2026SAMANTHA JACOBSON (Director) gave notice of a planned sale of 6,042 shares worth about $97K Form 144, approximate sale date Nov 11, 2026
-
8-KNov 9, 2026Quarterly results, Other events 8-K items 2.02, 8.01
-
10-QNov 9, 2026Quarterly report (10-Q) period ended Sep 30, 2026
-
8-KOct 20, 2026Director or officer change, Shareholder vote results 8-K items 5.02, 5.07
About the company
Trade Desk, Inc., Ventura, CA · from the 10-K filed Feb 27, 2026
We are a global leader in advertising technology. We empower ad buyers to create, manage and optimize digital advertising campaigns across ad formats, channels and devices. Our platform’s depth, artificial intelligence (“AI”) capabilities and rich ecosystem of inventory, publisher and data partner integrations enable superior reach and decisioning for clients. In addition to the primary capabilities provided by our self-service platform, our enterprise application programming interfaces (“APIs”) equip our clients with the ability to customize and expand platform functionality.
- Headquarters
- Ventura, CA
- Country
- United States
- Reports in
- USD
- Listed on
- Nasdaq
- Fiscal year ends
- December 31
- Last results
- Nov 9, 2026
- Incorporated in
- NV
Employees, at the top of the page: "As of December 31, 2025, we had 3,843 full-time employees in 21 countries" (10-K). Address and exchange: SEC's company file.
Email alerts
Sources
The 10-K filed Feb 27, 2026 (open at SEC), compared with the 10-K filed Feb 21, 2025. Numbers from the XBRL of the 10-Ks; filings from SEC EDGAR.
Work with it: Excel workbook · CSV. Google Sheet that stays up to date: paste =IMPORTDATA("https://tickdelta.com/company/TTD/export.csv") into a cell.