Amneal Pharmaceuticals, Inc. AMRX
Amneal Pharmaceuticals, Inc. (the “Company”, “we,” “us,” or “our”) is a diversified, global biopharmaceutical company that develops, manufactures, markets, and distributes a diverse portfolio of essential medicines. 10-K, Item 1
- Employees
- 8,500
- Next results
- around Jan 12, 2027
Where each dollar of revenue went, FY2025
Revenue of $3.0B through the costs to a net profit of $72.1M · income statement of the 10-K
AMRX among Health care peers
Six ratios from the latest 10-K. Each corner is the share of 154 peers the company is above, not a score.
What changed
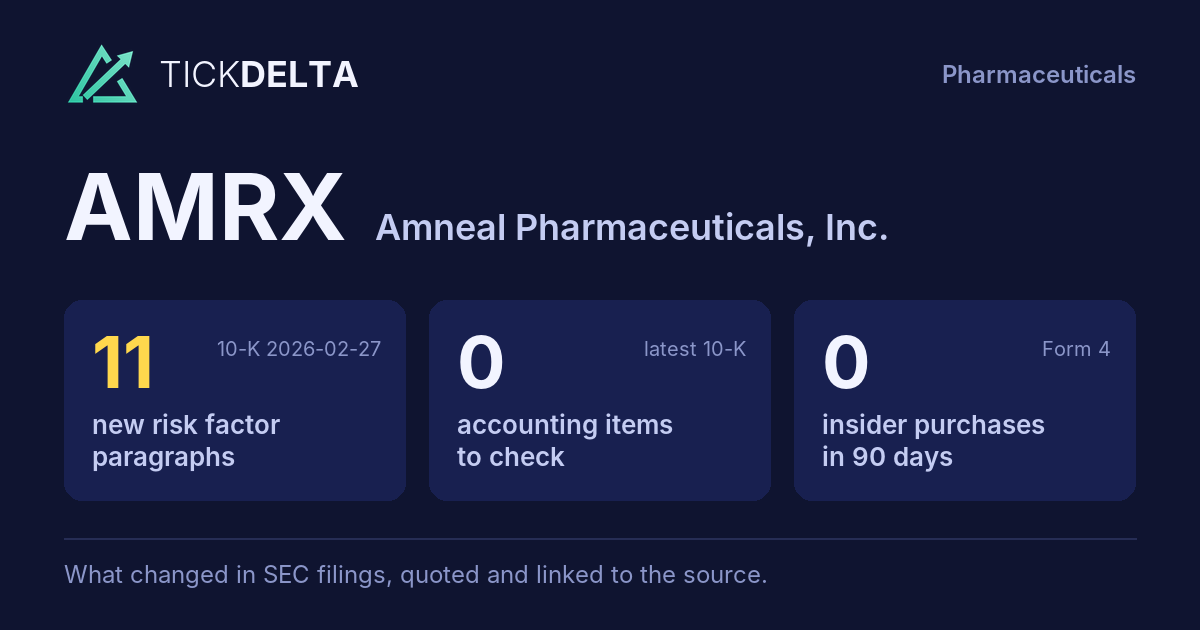
11 new risk paragraphs. 10-K filed Feb 27, 2026 against Feb 28, 2025.
Each row opens the detail with the quote and the filing. A row is a change worth reading, not a verdict.
Accounting checks
10 checks on the latest 10-K. Checks, not verdicts.
0facts worth reading about all 10 checks found nothing to note
-
Cash from operations $340.0M vs net income $72.1M (FY ending Dec 31, 2025)
-
Inventory -1.0% ($612.5M to $606.3M) vs revenue +8.0% ($2.8B to $3.0B), -9.1 pts apart
-
Same auditor in both 10-Ks: Ernst & Young LLP
7 more checks with nothing to note
-
No statement of substantial doubt about going concern
-
No 8-K item 4.02 in the last 2 years
-
No NT 10-K or NT 10-Q in the last 2 years
-
The same matters as last year: Medicaid Rebates; Sales Returns
-
No sentence in the 10-K concludes that controls were not effective because of a material weakness
-
No 8-K item 2.06 in the last 2 years
-
No 8-K item 1.03 in the last 2 years
In their words
11 paragraphs in Risk Factors that were not in the 10-K filed Feb 28, 2025. Quoted as filed.
-
Item 1A · new paragraph · not in the 10-K filed Feb 28, 2025 10-K, ITEM 1A
We are subject to certain trade and tariff requirements imposed by the U.S. and various foreign governments. The great majority of our net sales rely on finished dosage forms (“FDF”) or API produced in the U.S. or India. We have limited reliance on imports from Europe and China, and no reliance on imports from Mexico or Canada. Since…
-
Item 1A · new paragraph · not in the 10-K filed Feb 28, 2025 10-K, ITEM 1A
We rely on information technology systems for critical functions, including supply chain management, transaction processing, finance, human resources, sales order management, compliance, and reporting. In 2025, we began a multi-year enterprise resource planning (“ERP”) system implementation for certain parts of our business to integrate…
-
Item 1A · new paragraph · not in the 10-K filed Feb 28, 2025 10-K, ITEM 1A
We rely on our internal technology systems and websites to run our business as well as our or our third-party partners’ physical facilities, such as our R&D or manufacturing premises. In addition, we rely on third-party hosted services. A disruption, infiltration or failure of these systems, facilities or third-party hosted services in…
-
Item 1A · new paragraph · not in the 10-K filed Feb 28, 2025 10-K, ITEM 1A
Escalating geopolitical tensions or military conflict between India and Pakistan could disrupt our operations, supply chain, or workforce in the region, potentially resulting in production delays, increased costs, or reduced availability of key materials. Any sustained instability in the region could also impair our ability to maintain…
New risk paragraphs, against peers
Latest 10-K of each, Health care companies closest in revenue
Paragraphs in Risk Factors with nothing like them in the company's 10-K the year before. A count of text, not of risk.
Financial performance
Last 4 fiscal years · 10-K XBRL
| Metric | FY2022 | FY2023 | FY2024 | FY2025 |
|---|---|---|---|---|
| Revenue | $2.2B | $2.4B | $2.8B | $3.0B |
| Net income | −$270.6M | −$84.0M | −$116.9M | $72.1M |
| Operating cash flow | $65.1M | $345.6M | $295.1M | $340.0M |
| Free cash flow | $18.7M | $302.4M | $243.2M | $269.9M |
Revenue, FY2016 to FY2025
Ten fiscal years, each from its own 10-K · XBRL · USD
$3.0B ▲ 8.0% in FY2025$72.1M in FY2025$269.9M ▲ 11.0% in FY2025
Recent filings
4 filings in the last 30 days · SEC EDGAR
-
SEC letterNov 13, 2026SEC asked 1 question about Form 10-K for the Fiscal Year Ended December 31, 2021 letters Jun 27, 2022 to Aug 5, 2022 · Revenue, Segments
-
10-QNov 9, 2026Quarterly report (10-Q) period ended Sep 30, 2026
-
8-KNov 3, 2026Quarterly results, Regulation FD disclosure 8-K items 2.02, 7.01
-
8-KOct 23, 2026Current report (amended) 8-K
About the company
Amneal Pharmaceuticals, Inc. · from the 10-K filed Feb 27, 2026
Amneal Pharmaceuticals, Inc. (the “Company”, “we,” “us,” or “our”) is a diversified, global biopharmaceutical company that develops, manufactures, markets, and distributes a diverse portfolio of essential medicines. Our Affordable Medicines segment includes retail generics, injectables, and biosimilars. In our Specialty segment, we offer a portfolio of branded pharmaceuticals focused primarily on central nervous system and endocrine disorders. Through our AvKARE segment, we are a distributor of pharmaceuticals and other products for the U.S. federal government, retail, and institutional markets. We operate principally in the United States (“U.S.”), India, and Ireland.
- Reports in
- USD
- Listed on
- Nasdaq
- Fiscal year ends
- December 31
- Last results
- Nov 3, 2026
Employees, at the top of the page: "As of December 31, 2025, we had over 8,500 employees (“Amneal Employees”), excluding approximately 200 employees in our AvKARE segment" (10-K). Address and exchange: SEC's company file.
Email alerts
Sources
The 10-K filed Feb 27, 2026 (open at SEC), compared with the 10-K filed Feb 28, 2025. Numbers from the XBRL of the 10-Ks; filings from SEC EDGAR.
Work with it: Excel workbook · CSV. Google Sheet that stays up to date: paste =IMPORTDATA("https://tickdelta.com/company/AMRX/export.csv") into a cell.