Dynatrace, Inc. DT
Dynatrace combines broad and deep observability, continuous runtime application security, and advanced agentic AI operations to deliver answers and intelligent automation across IT operations, development, security, business, and executive teams. 10-K, Item 1
- Employees
- 5,600
- Headquarters
- Boston, MA
- CEO
- Rick M. McConnell
- Next results
- around Feb 8, 2027
Where each dollar of revenue went, FY2026
Revenue of $2.0B through the costs to a net profit of $162.7M · income statement of the 10-K
DT among Technology peers
Six ratios from the latest 10-K. Each corner is the share of 230 peers the company is above, not a score.
What changed
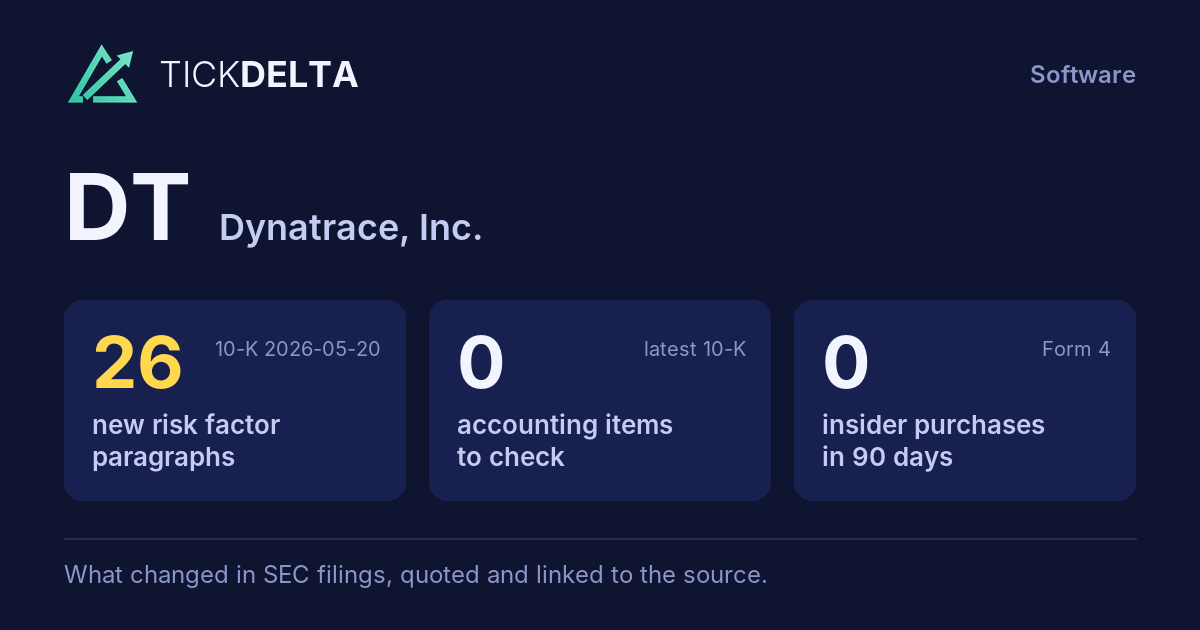
26 new risk paragraphs. 10-K filed May 20, 2026 against May 22, 2025.
Each row opens the detail with the quote and the filing. A row is a change worth reading, not a verdict.
Accounting checks
10 checks on the latest 10-K. Checks, not verdicts.
0facts worth reading about all 10 checks found nothing to note
-
Receivables +13.7% ($624.4M to $710.2M) vs revenue +18.8% ($1.7B to $2.0B), -5.1 pts apart
-
Cash from operations $561.9M vs net income $162.7M (FY ending Mar 31, 2026)
-
Same auditor in both 10-Ks: Ernst & Young, LLP
7 more checks with nothing to note
-
No statement of substantial doubt about going concern
-
No 8-K item 4.02 in the last 2 years
-
No NT 10-K or NT 10-Q in the last 2 years
-
No longer listed: Income Taxes – Valuation of Transferred IP. Same as last year: Revenue Recognition – Determination of Distinct Performance Obligations
-
No sentence in the 10-K concludes that controls were not effective because of a material weakness
-
No 8-K item 2.06 in the last 2 years
-
No 8-K item 1.03 in the last 2 years
In their words
26 paragraphs in Risk Factors that were not in the 10-K filed May 22, 2025. Quoted as filed.
-
Item 1A · new paragraph · not in the 10-K filed May 22, 2025 10-K, ITEM 1A
We have incorporated AI into our platform and AI is changing the competitive dynamics of our industry. Our competitors or other third parties may incorporate AI into their products more quickly or more successfully than us, may invest more in AI development than us, or have access to more advanced AI models or autonomous agents with…
-
Item 1A · new paragraph · not in the 10-K filed May 22, 2025 10-K, ITEM 1A
Our use of new and evolving technologies, including AI in our offerings and business, may present risks and challenges that can impact our business, including by posing cybersecurity, operational, and other risks to our confidential and/or proprietary information, including personal information, and as a result we may be exposed to…
-
Item 1A · new paragraph · not in the 10-K filed May 22, 2025 10-K, ITEM 1A
As a global company, our business is increasingly exposed to risks arising from adverse changes in U.S. and international economic conditions and geopolitical instability. Uncertainty in the macroeconomic environment has resulted, and may continue to result, in volatility in credit, equity and foreign currency markets and fluctuating…
-
Item 1A · new paragraph · not in the 10-K filed May 22, 2025 10-K, ITEM 1A
The “One Big Beautiful Bill Act” (the “OBBBA”), enacted in 2025, contains a broad range of tax reform provisions including immediate expensing of domestic research and development expenditures, the reinstatement of 100% bonus depreciation, and modifications to the international tax framework. The OBBBA has multiple effective dates, with…
New risk paragraphs, against peers
Latest 10-K of each, Technology companies closest in revenue
Paragraphs in Risk Factors with nothing like them in the company's 10-K the year before. A count of text, not of risk.
Financial performance
Last 4 fiscal years · 10-K XBRL
| Metric | FY2023 | FY2024 | FY2025 | FY2026 |
|---|---|---|---|---|
| Revenue | $1.2B | $1.4B | $1.7B | $2.0B |
| Net income | $108.0M | $154.6M | $483.7M | $162.7M |
| Operating cash flow | $354.9M | $378.1M | $459.4M | $561.9M |
| Free cash flow | $333.3M | $351.6M | $433.3M | $529.7M |
Revenue, FY2018 to FY2026
Ten fiscal years, each from its own 10-K · XBRL · USD
$2.0B ▲ 18.8% in FY2026$162.7M ▼ 66.4% in FY2026$529.7M ▲ 22.2% in FY2026
Recent filings
4 filings in the last 30 days · SEC EDGAR
-
Planned saleNov 3, 2026Lisa Campbell (director) adopted a 10b5-1 trading plan reported in the 10-Q, up to 3,000 shares, runs to Sep 10, 2027
-
Planned saleNov 3, 2026Daniel Zugelder (Executive Vice President, Chief Revenue Officer) adopted a 10b5-1 trading plan reported in the 10-Q, runs to Dec 22, 2027
-
8-KNov 3, 2026Quarterly results, Other events 8-K items 2.02, 8.01
-
10-QNov 3, 2026Quarterly report (10-Q) period ended Sep 30, 2026
About the company
Dynatrace, Inc., Boston, MA · from the 10-K filed May 20, 2026
Dynatrace combines broad and deep observability, continuous runtime application security, and advanced agentic AI operations to deliver answers and intelligent automation across IT operations, development, security, business, and executive teams. This unified approach enables organizations to optimize their rapidly evolving AI, cloud, and IT operations, accelerate secure software delivery, and improve digital performance. Our vision is a world where software works perfectly.
- Headquarters
- Boston, MA
- Country
- United States
- Reports in
- USD
- Listed on
- NYSE
- Fiscal year ends
- March 31
- Last results
- Nov 3, 2026
- Incorporated in
- DE
Employees, at the top of the page: "As of March 31, 2026, we had approximately 5,600 employees, approximately 30% of whom were located in the United States, and approximately 28% of whom were located in Austria" (10-K). Address and exchange: SEC's company file.
Email alerts
Sources
The 10-K filed May 20, 2026 (open at SEC), compared with the 10-K filed May 22, 2025. Numbers from the XBRL of the 10-Ks; filings from SEC EDGAR.
Work with it: Excel workbook · CSV. Google Sheet that stays up to date: paste =IMPORTDATA("https://tickdelta.com/company/DT/export.csv") into a cell.