Crane Co CR
Crane Company has delivered innovation and technology-led solutions for customers since its founding in 1855. 10-K, Item 1
- Employees
- 4,100
- Headquarters
- Stamford, CT
- Next results
- around Jan 25, 2027
Where each dollar of revenue went, FY2025
Revenue of $2.3B through the costs to a net profit of $366.6M · income statement of the 10-K
CR among Industrials peers
Six ratios from the latest 10-K. Each corner is the share of 251 peers the company is above, not a score.
What changed
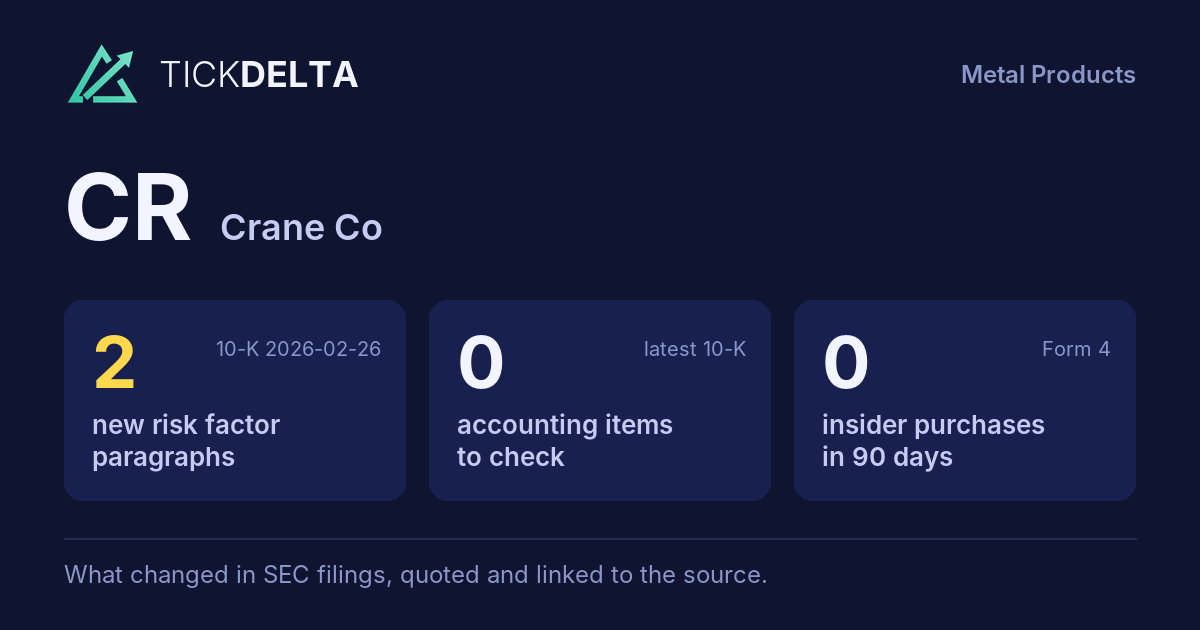
2 new risk paragraphs. 10-K filed Feb 26, 2026 against Feb 27, 2025.
Each row opens the detail with the quote and the filing. A row is a change worth reading, not a verdict.
Accounting checks
11 checks on the latest 10-K. Checks, not verdicts.
0facts worth reading about all 11 checks found nothing to note
-
Receivables +5.8% ($339.1M to $358.7M) vs revenue +8.2% ($2.1B to $2.3B), -2.4 pts apart
-
Cash from operations $394.8M vs net income $366.6M (FY ending Dec 31, 2025)
-
Inventory -1.0% ($380.4M to $376.5M) vs revenue +8.2% ($2.1B to $2.3B), -9.2 pts apart
8 more checks with nothing to note
-
Same auditor in both 10-Ks: Deloitte & Touche LLP
-
No statement of substantial doubt about going concern
-
No 8-K item 4.02 in the last 2 years
-
No NT 10-K or NT 10-Q in the last 2 years
-
The same matters as last year: Revenue - Over-Time Basis; Audit Matter Description
-
No sentence in the 10-K concludes that controls were not effective because of a material weakness
-
No 8-K item 2.06 in the last 2 years
-
No 8-K item 1.03 in the last 2 years
In their words
2 paragraphs in Risk Factors that were not in the 10-K filed Feb 27, 2025. Quoted as filed.
-
Item 1A · new paragraph · not in the 10-K filed Feb 27, 2025 10-K, ITEM 1A
•Ongoing or threatened U.S. government shutdowns which may impact our ability to obtain or progress on government contracts, primarily in our Aerospace and Advanced Technologies segment.
-
Item 1A · new paragraph · not in the 10-K filed Feb 27, 2025 10-K, ITEM 1A
•Maintenance of uniform standards, controls, policies and procedures, in particular where acquisitions reflect carve-out transactions;
New risk paragraphs, against peers
Latest 10-K of each, Industrials companies closest in revenue
Paragraphs in Risk Factors with nothing like them in the company's 10-K the year before. A count of text, not of risk.
Financial performance
Last 4 fiscal years · 10-K XBRL
| Metric | FY2022 | FY2023 | FY2024 | FY2025 |
|---|---|---|---|---|
| Revenue | $1.8B | $1.9B | $2.1B | $2.3B |
| Net income | $401.1M | $255.9M | $294.7M | $366.6M |
| Operating cash flow | −$498.8M | $162.1M | $257.8M | $394.8M |
Revenue, FY2021 to FY2025
Ten fiscal years, each from its own 10-K · XBRL · USD
$2.3B ▲ 8.2% in FY2025$366.6M ▲ 24.4% in FY2025
Recent filings
3 filings in the last 30 days · SEC EDGAR
-
SEC letterNov 14, 2026SEC asked 3 questions about Form 10-K for the Year Ended December 31, 2023 letters May 28, 2024 to Jun 13, 2024 · Results discussion (MD&A), Liquidity and cash, Non-GAAP measures
-
10-QOct 29, 2026Quarterly report (10-Q) period ended Sep 30, 2026
-
8-KOct 27, 2026Quarterly results 8-K item 2.02
About the company
Crane Co, Stamford, CT · from the 10-K filed Feb 26, 2026
Crane Company has delivered innovation and technology-led solutions for customers since its founding in 1855. Today, Crane is a leading manufacturer of highly engineered components for challenging, mission-critical applications focused on the aerospace, defense, space and process industry end markets. The Company has two reporting segments: Aerospace & Advanced Technologies (“AAT”) and Process Flow Technologies (“PFT”).
- Headquarters
- Stamford, CT
- Country
- United States
- Reports in
- USD
- Listed on
- NYSE
- Fiscal year ends
- December 31
- Last results
- Oct 27, 2026
- Incorporated in
- DE
Employees, at the top of the page: "In the United States, we employed approximately 4,100 people across 37 locations" (10-K). Address and exchange: SEC's company file.
Email alerts
Sources
The 10-K filed Feb 26, 2026 (open at SEC), compared with the 10-K filed Feb 27, 2025. Numbers from the XBRL of the 10-Ks; filings from SEC EDGAR.
Work with it: Excel workbook · CSV. Google Sheet that stays up to date: paste =IMPORTDATA("https://tickdelta.com/company/CR/export.csv") into a cell.