Aecom ACM
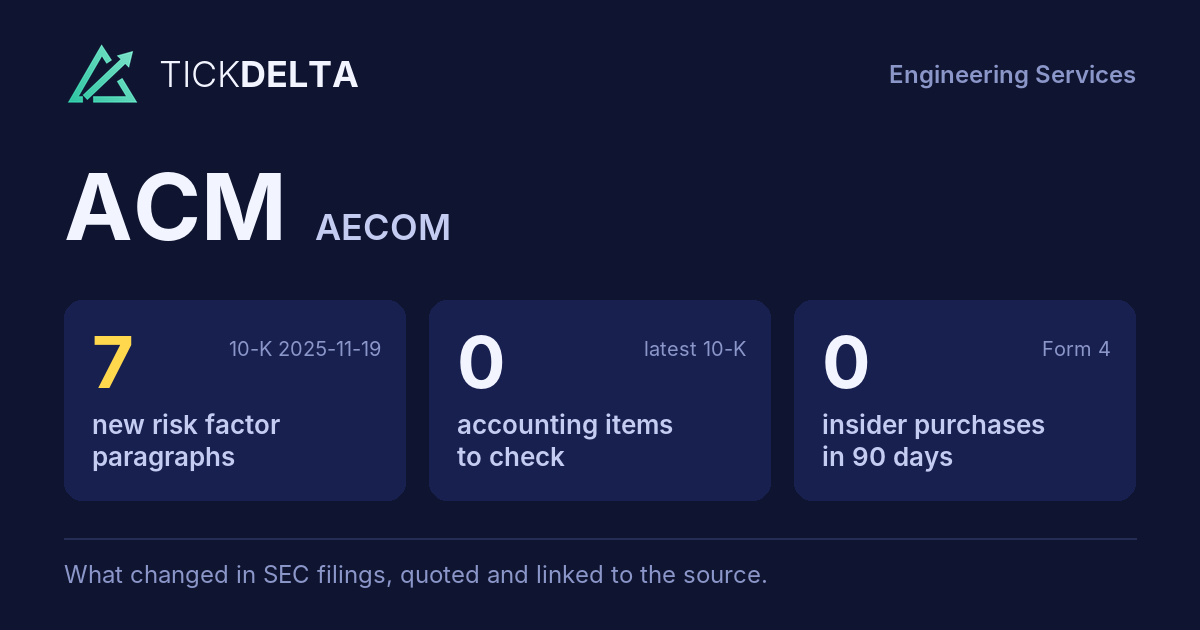
The biggest changes in the 10-K filed Nov 19, 2025, in management's words
10-K, Item 7This fiscal year against the last, and the sentences in the MD&A where management explains each change. Tickdelta picks sentences that name the line, a direction and a cause. It does not write explanations of its own.
Net income
Big change, FY to Sep 30, 2025 vs Sep 30, 2024
“The decrease in other income for the year ended September 30, 2025 was primarily due to the decrease in fair value of our investments measured at fair value.”
Read it in the 10-K
Operating margin
Big change, FY to Sep 30, 2025 vs Sep 30, 2024
The MD&A has no sentence that names a cause for this change.
Gross margin
Change, FY to Sep 30, 2025 vs Sep 30, 2024
“The decrease in cost of revenue for the year ended September 30, 2025 was primarily due to the decreases in subcontractor and other direct costs offset by increased project activity.”
Read it in the 10-K
“The increase in gross profit for the year ended September 30, 2025 was primarily due to the benefit from restructuring actions taken last year, growth in enterprise capability centers, ongoing continuous improvement initiatives, and growth in higher margin advisory services.”
Read it in the 10-K
Cash from operations
Change, FY to Sep 30, 2025 vs Sep 30, 2024
The MD&A has no sentence that names a cause for this change.
Revenue
Change, FY to Sep 30, 2025 vs Sep 30, 2024
“The portion of revenue excluding pass-through revenues attributable to subcontractors increased for the year ended September 30, 2025.”
Read it in the 10-K
“Revenue from increased project activity in the Americas included growth in our Transportation end market of $261.1 million, or 11.7%, and our Water and Environment end markets of $127.4 million, or 6.0%, offset by a decrease in our Facilities end market of $344.7 million, or 4.3%, compared to the corresponding period last year.”
Read it in the 10-K
What management said, year by year
The cause given in each 10-K, 2 fiscal years, newest first · MD&A (Item 7)
Each bar is how the line changed that year (from the same 10-K's XBRL). Under it, the sentence in that year's MD&A that names the line, a direction and a cause, word for word. A year with no sentence says so.
Revenue
2 of 2 years explained-
FY 2025 +0.2%
“The portion of revenue excluding pass-through revenues attributable to subcontractors increased for the year ended September 30, 2025.”
Read it in the FY 2025 10-K“Revenue from increased project activity in the Americas included growth in our Transportation end market of $261.1 million, or 11.7%, and our Water and Environment end markets of $127.4 million, or 6.0%, offset by a decrease in our Facilities end market of $344.7 million, or 4.3%, compared to the corresponding period last year.”
Read it in the FY 2025 10-K -
FY 2024 +12.0%
“Revenue increased across most of our end markets as a result of increased investment by large, publicly financed, global infrastructure programs including the Infrastructure Investment and Jobs Act in the U.S. and similar large programs in our largest end markets globally.”
Read it in the FY 2024 10-K“The increase in revenue for the year ended September 30, 2024 was primarily due to growth in Europe of $104.5 million and the Middle East of $133.3 million compared to the corresponding period last year.”
Read it in the FY 2024 10-K
Gross margin
2 of 2 years explained-
FY 2025 +0.8 pts
“The decrease in cost of revenue for the year ended September 30, 2025 was primarily due to the decreases in subcontractor and other direct costs offset by increased project activity.”
Read it in the FY 2025 10-K“The increase in gross profit for the year ended September 30, 2025 was primarily due to the benefit from restructuring actions taken last year, growth in enterprise capability centers, ongoing continuous improvement initiatives, and growth in higher margin advisory services.”
Read it in the FY 2025 10-K -
FY 2024 +0.2 pts
“The increase in cost of revenue for the year ended September 30, 2024 was due to an increase in subcontractor and other direct costs of $1,224.4 million due to a higher proportion of contracts requiring us to subcontract work on behalf of our clients, with the balance of the increases due to higher labor volume compared to the same periods in the prior year.”
Read it in the FY 2024 10-K“The increase in gross profit for the year ended September 30, 2024 was primarily due to revenue growth and delivery efficiencies realized from cost reductions.”
Read it in the FY 2024 10-K
Operating margin
0 of 2 years explained-
FY 2025 +1.2 pts
The FY 2025 MD&A has no sentence that names a cause for this change.
-
FY 2024 +2.9 pts
The FY 2024 MD&A has no sentence that names a cause for this change.
Net income
2 of 2 years explained-
FY 2025 +39.7%
“The decrease in other income for the year ended September 30, 2025 was primarily due to the decrease in fair value of our investments measured at fair value.”
Read it in the FY 2025 10-K -
FY 2024 +627.0%
“The increase in other income for the year ended September 30, 2024 was primarily due to the increase in fair value of our investments measured at fair value.”
Read it in the FY 2024 10-K
Cash from operations
0 of 2 years explained-
FY 2025 -0.7%
The FY 2025 MD&A has no sentence that names a cause for this change.
-
FY 2024 +18.9%
The FY 2024 MD&A has no sentence that names a cause for this change.
Changes are computed from the XBRL figures in the same 10-K. Hover a number to see the line item. Open the 10-K
Sources
The Management's Discussion and Analysis (Item 7) of the latest 10-K, quoted word for word; the changes are computed from the same 10-K's XBRL.
Also
Financials: the numbers year by year.
Work with it
Excel workbook · CSV. Google Sheet that stays up to date: paste =IMPORTDATA("https://tickdelta.com/company/ACM/export.csv") into a cell.