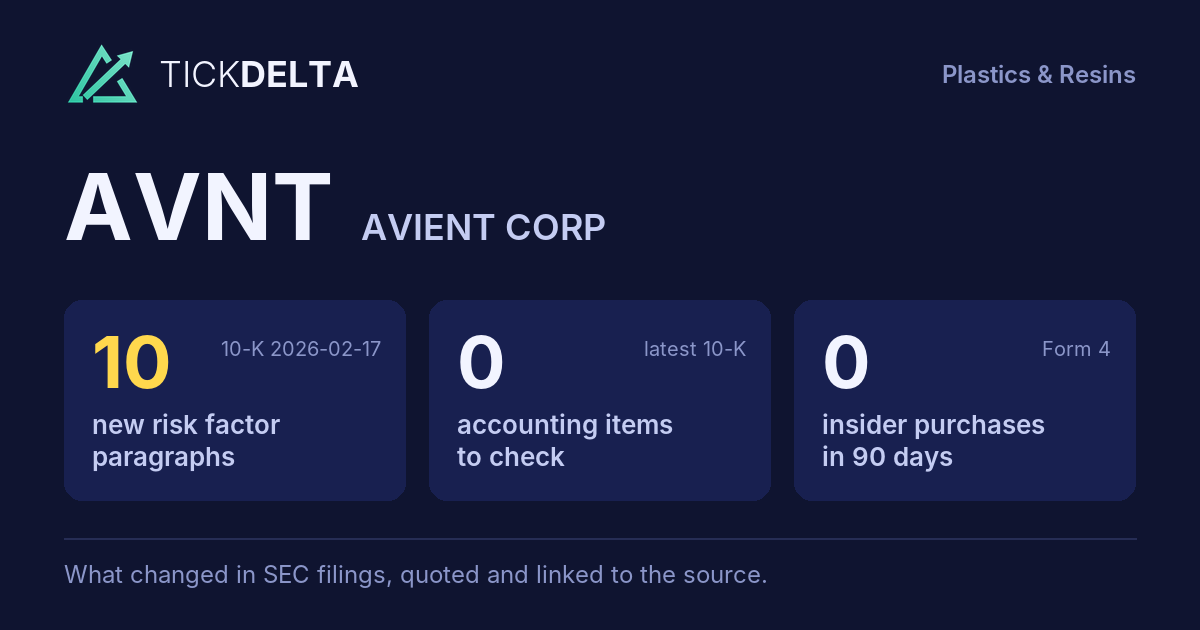
Screener / SEC EDGAR /CIK 0001122976 /10-K filed Feb 17, 2026, compared with Feb 18, 2025 /Numbers from the XBRL of the 10-Ks
NYSE Materials · Plastics & Resins

Avient Corp AVNT

Compare with peers Embed
Earnings releases

Latest results release: Nov 4, 2026

8-K item 2.02, exhibit 99

What AVNT's management wrote with each quarter's results: the press release and, when the company files them, its prepared remarks or the call transcript. The call itself is not filed with SEC, so most quarters have the release only.

Adjusted vs GAAP earnings per share

In the company's own words · read from each release, never computed

In its release of May 7, 2026, AVNT reported $0.61 per share under GAAP and $0.83 on its own adjusted basis: the adjusted number is +36% above GAAP.

GAAP EPS $0.54, release May 7, 2024: First quarter GAAP earnings per share (EPS) from continuing operations was $0.54 compared to $0.23 in the prior year quarter. Adjusted EPS $0.76, release May 7, 2024: First quarter 2024 adjusted EPS was $0.76 compared to $0.63 in the prior year. +41% 2024-05 GAAP EPS $0.36, release Aug 6, 2024: Second quarter GAAP earnings per share (EPS) from continuing operations was $0.36 compared to $0.24 in the prior year quarter. Adjusted EPS $0.76, release Aug 6, 2024: Second quarter 2024 adjusted EPS was $0.76 compared to $0.63 in the prior year. +111% 2024-08 GAAP EPS $0.41, release Oct 31, 2024: Third quarter GAAP earnings per share (EPS) from continuing operations were $0.41 compared to $0.06 in the prior year quarter. Adjusted EPS $0.65, release Oct 31, 2024: Third quarter 2024 adjusted EPS were $0.65 compared to $0.57 in the prior year. +58% 2024-10 GAAP EPS $0.57, release Aug 1, 2025: Second quarter GAAP earnings per share (EPS) were $0.57 compared to $0.36 in the prior year quarter. Adjusted EPS $0.80, release Aug 1, 2025: Second quarter 2025 adjusted EPS were $0.80 compared to $0.76 in the prior year quarter, representing 5% adjusted EPS growth and includes a favorable impact of $0.01 attributable to foreign exchange. +40% 2025-08 GAAP EPS $0.36, release Nov 5, 2025: Third quarter GAAP earnings per share (EPS) were $0.36 compared to $0.41 in the prior year quarter. Adjusted EPS $0.70, release Nov 5, 2025: Third quarter 2025 adjusted EPS were $0.70 compared to $0.65 in the prior year quarter and includes a favorable impact of $0.02 attributable to foreign exchange. +94% 2025-11 GAAP EPS $0.61, release May 7, 2026: First quarter GAAP earnings per share (EPS) were $0.61 compared to ($0.22) in the prior year quarter. Adjusted EPS $0.83, release May 7, 2026: First quarter 2026 adjusted EPS was $0.83 compared to $0.76 in the prior year quarter, reflecting 9% growth in adjusted EPS. +36% 2026-05
GAAP EPSAdjusted EPS, as the company defines itThe figure on top is how far adjusted is from GAAP. Click a bar for the sentence.
ReleaseGAAP EPSAdjusted EPSGap
May 7, 2026 0.61 0.83 +36%
Nov 5, 2025 0.36 0.70 +94%
Aug 1, 2025 0.57 0.80 +40%
Oct 31, 2024 0.41 0.65 +58%
Aug 6, 2024 0.36 0.76 +111%
May 7, 2024 0.54 0.76 +41%
The company's words, latest release
First quarter GAAP earnings per share (EPS) were $0.61 compared to ($0.22) in the prior year quarter. release
First quarter 2026 adjusted EPS was $0.83 compared to $0.76 in the prior year quarter, reflecting 9% growth in adjusted EPS. release

What the company says its adjusted numbers leave out:

(In millions, except per share data) Senior management uses comparisons of adjusted net income attributable to Avient common shareholders and diluted adjusted earnings per share (EPS) attributable to Avient common shareholders, excluding special items, to assess performance and facilitate comparability of results. release Nov 4, 2026

Both numbers are read from the words of each release (usually the highlights), never computed by us; hover a number for its sentence. Quarters where the release gives them only in a table are not shown. The company decides what "adjusted" leaves out; the full reconciliation is in the release.

Read and search

Every release, in full · linked to sec.gov

Press release Nov 4, 2026 · EX-99.1

Avient Announces Third Quarter 2026 Results Ahead of Expectations; Increases

Open on SEC

Avient Announces Third Quarter 2026 Results Ahead of Expectations; Increases Full-Year Adjusted EPS Guidance Range • Third quarter sales grew 10.5% to $891 million, driven by strong sales growth in both business segments

• Third quarter adjusted EPS grew 23% over the prior year quarter to $0.86; exceeded adjusted EPS guidance of $0.80, primarily driven by better-than- expected sales growth

• Strong cash flow generation supported $50 million of debt repayment in the third quarter bringing total year-to-date 2026 debt reduction to $100 million

• Increasing 2026 full year adjusted EPS guidance range to $3.22 to $3.32 from previous guidance of $3.10 to $3.25; updated full year adjusted EPS guidance range represents 14% to 18% growth over the prior year CLEVELAND – November 4, 2026 – Avient Corporation (NYSE: AVNT), an innovator of materials solutions, today announced its third quarter results for 2026. Third quarter GAAP earnings per share (EPS) were $0.46 compared to $0.36 in the prior year quarter.

In the third quarter 2026, sales grew 10.5% to $891 million, which included a negative 0.1% impact from unfavorable foreign exchange. Excluding the impact of foreign exchange, organic sales growth was 10.6%

The company noted that in the third quarter 2026, GAAP EPS includes special items of $0.23 and intangible amortization expense of $0.17 compared to special items of $0.17 and intangible amortization of $0.17 in the third quarter 2025 (see attachment 1).

Third quarter 2026 adjusted EPS was $0.86 compared to $0.70 in the prior year quarter, reflecting 23% growth in adjusted EPS over the prior year quarter.

"Our teams delivered a strong third quarter, driven by sales growth across nearly all our markets, in particular packaging, healthcare and building & construction,” said Mike Frank, President and Chief Executive Officer, Avient Corporation. 1 “Both operating segments contributed organic sales growth in the quarter, driven by pricing, in combination with improving mix from new business gains and strong demand for our growth vector technologies. Our strategy is delivering tangible results by aligning Avient’s capabilities with high-growth secular trends and advancing productivity initiatives that support top-line growth and margin expansion. As a result, organic sales grew 10.6% and adjusted EBITDA margins expanded by 80 basis points to 17.3%.” added Mr. Frank.

“Our teams continue to demonstrate their ability to stay nimble in managing a volatile business environment while executing our strategy. Supported by our year-to-date results and visibility into fourth quarter demand, we are narrowing our full-year 2026 adjusted EBITDA guidance to $593 to $603 million and raising our adjusted EPS guidance to $3.22 to $3.32, representing 9% to 11% adjusted EBITDA growth and 14% to 18% adjusted EPS growth for the year,” said Joe Di Salvo, Senior Vice President and Chief Financial Officer.

“Strong cash generation is allowing us to invest in growth while strengthening our balance sheet. Year-to-date in 2026, we have repaid a total of $100 million of debt, including $50 million repaid during the third quarter. We expect to end 2026 with net debt to adjusted EBITDA leverage ratio of 2.2x to 2.3x. Additionally, subsequent to quarter end, we have repurchased shares for the first time since 2022, repurchasing 281,000 shares for approximately $10.9 million. Going forward, I expect we will take a balanced approach to deploying excess cash for further debt reduction and opportunistic share repurchases," said Mr. Di Salvo.

Mr. Frank added, "Since joining Avient, I have been impressed with our customer focus, innovation capabilities and operational discipline. I believe there is considerable opportunity to continue to drive profitable growth through enhancing our market penetration in key growth segments, as well as increasing share and value in our core markets. Disciplined capital allocation will also be a key area of focus as we continue to strengthen our balance sheet. I expect to continue to build on the momentum we have created this year, while accelerating our mission to materialize a brighter future.” 2

Avient will provide additional details on its 2026 third quarter and its 2026 full year outlook during its webcast scheduled for 8:00 a.m. Eastern Time on November 4, 2026.

The webcast can be viewed live at avient.com/investors , or by clicking on the webcast link here . Conference call participants in the question and answer session should pre-register using the link at avient.com/investors , or here , to receive the dial-in number and personal PIN. This information is required to access the conference call. The question-and-answer session will follow the company’s presentation and prepared remarks.

A recording of the webcast and the slide presentation will be available at avient.com/investors/events-presentations immediately following the conference call and will be accessible for one year. 3

The Company uses both GAAP (generally accepted accounting principles) and non- GAAP financial measures. The non-GAAP financial measures include organic performance (which excludes the impact of foreign exchange), adjusted EPS, adjusted operating income, adjusted EBITDA, adjusted EBITDA margins, free cash flow and adjusted free cash flow. Avient's chief operating decision maker uses these financial measures to monitor and evaluate the ongoing performance of the Company and each business segment and to allocate resources.

The Company does not provide reconciliations of forward-looking non-GAAP financial measures, such as adjusted EPS, adjusted EBITDA and free cash flow, to the most comparable GAAP financial measures on a forward-looking basis because the Company is unable to provide a meaningful or accurate calculation or estimation of reconciling items, and the information is not available without unreasonable effort. This is due to the inherent difficulty of forecasting the timing and amount of certain items, such as, but not limited to, environmental remediation costs and associated recoveries, mark-to-market adjustments on pension and other post-retirement obligations, acquisition-related charges, and other non-routine costs. Each of such adjustments has not yet occurred, are out of the Company's control and/or cannot be reasonably predicted. For the same reasons, the Company is unable to address the probable significance of the unavailable information.

Our purpose at Avient Corporation (NYSE: AVNT) is to be an innovator of materials solutions that help our customers succeed, while enabling a sustainable world. Our local touch and customer engagement, combined with our global presence, allows us to serve customers with agility. We harness the collective strength of more than 9,000 employees worldwide to collaborate and build on each other's ideas. In doing so, we innovate solutions that help our customers overcome their challenges or capitalize on opportunities provided by the fast-changing world and secular trends. Our expanding portfolio of offerings includes colorants, advanced composites, functional additives, engineered materials, and Dyneema®, the world’s strongest fiber™. By intersecting our broad portfolio of technologies with the product roadmaps of our customers, we help create differentiated and high-performance products that make the world better and more sustainable. Visit www.avient.com to learn more. 4

In this press release, statements that are not reported financial results or other historical information are "forward-looking statements" within the meaning of the Private Securities Litigation Reform Act of 1995. Forward-looking statements give current expectations or forecasts of future events and are not guarantees of future performance. They are based on management's expectations that involve a number of business risks and uncertainties, any of which could cause actual results to differ materially from those expressed in or implied by the forward-looking statements. They use words such as "will," "anticipate," "estimate," "expect," "project," "intend," "plan," "believe," and other words and terms of similar meaning in connection with any discussion of future operating or financial condition, performance and/or sales. Factors that could cause actual results to differ materially from those implied by these forward- looking statements include, but are not limited to: disruptions, uncertainty or volatility in the global credit markets that could adversely impact the availability of credit already arranged and the availability and cost of credit in the future; the effect on foreign operations of currency fluctuations, tariffs and other political, economic and regulatory risks; disruptions or inefficiencies in our supply chain, logistics, or operations; changes in laws and regulations in jurisdictions where we conduct business, including with respect to plastics and climate change; changes to foreign trade policy, including new or increased tariffs and changing import/export regulation; fluctuations in raw material prices, quality and supply, and in energy prices and supply; demand for our products and services; production outages or material costs associated with scheduled or unscheduled maintenance programs; unanticipated developments that could occur with respect to contingencies such as litigation and environmental matters; our ability to pay regular quarterly cash dividends and the amounts and timing of any future dividends; information systems failures, cybersecurity breaches and cyberattacks; our ability to service our indebtedness and restrictions on our current and future operations due to our indebtedness; amounts for cash and non-cash charges related to restructuring plans that may differ from original estimates, including because of timing changes associated with the underlying actions; and other factors affecting our business beyond our control, including without limitation, changes in the general economy, changes in interest rates, changes in the rate of inflation, geopolitical conflicts and any recessionary conditions. The above list of factors is not exhaustive.

Any forward-looking statement speaks only as of the date on which such statement is made, and we undertake no obligation to publicly update forward-looking statements, whether as a result of new information, future events or otherwise. You are advised to consult any further disclosures we make on related subjects in our reports on Form 10-Q, 8-K and 10-K that we provide to the Securities and Exchange Commission. 5 Investor Relations Contact: George T. Clark

(In millions, except per share data) Senior management uses comparisons of adjusted net income attributable to Avient common shareholders and diluted adjusted earnings per share (EPS) attributable to Avient common shareholders, excluding special items, to assess performance and facilitate comparability of results. Further, as a result of Avient's strategic shift towards an innovator of materials solutions, it has completed several acquisitions and divestitures which have resulted in a significant amount of intangible asset amortization. Management excludes intangible asset amortization from adjusted EPS as it believes excluding acquired intangible asset amortization is a useful measure of current period earnings per share. Senior management believes these measures are useful to investors because they allow for comparison to Avient's performance in prior periods without the effect of items that, by their nature, tend to obscure Avient's operating results due to the potential variability across periods based on timing, frequency and magnitude. Non-GAAP financial measures have limitations as analytical tools and should not be considered in isolation from, or solely as alternatives to, financial measures prepared in accordance with GAAP. Below is a reconciliation of these non-GAAP financial measures to their most directly comparable financial measures calculated and presented in accordance with GAAP. See Attachment 3 for a definition and summary of special items.

(1) Per share amounts may not recalculate from figures presented herein due to rounding

(1) Per share amounts may not recalculate from figures presented herein due to rounding 7

(1) Special items include charges related to specific strategic initiatives or financial restructuring such as: consolidation of operations; debt extinguishment costs; costs incurred directly in relation to acquisitions or divestitures; employee separation costs resulting from personnel reduction programs, plant realignment costs, executive separation agreements; asset impairments; settlement gains or losses and mark-to-market adjustments associated with gains and losses on pension and other post-retirement benefit plans; environmental remediation costs, fines, penalties and related insurance recoveries related to facilities no longer owned or closed in prior years; gains and losses on facility or property sales or disposals; results of litigation, fines or penalties, where such litigation (or action relating to the fines or penalties) arose prior to the commencement of the performance period; one-time, non-recurring items; and the effect of changes in accounting principles or other such laws or provisions affecting reported results.

(2) The tax effect has been calculated using a blended statutory tax rate for the jurisdictions in which the special item was recognized, except when a jurisdiction is in a valuation allowance in which case no tax benefit is recognized.

(3) Tax adjustments include the net tax impact from non-recurring income tax items and certain adjustments to uncertain tax position reserves and valuation allowances. 9

(Unaudited) September 30, 2026 December 31, 2025 ────────────────────────────────────────────────────────────────────────────── ASSETS Current assets: Cash and cash equivalents $ 445.7 $ 510.5 Accounts receivable, net 520.7 435.0 Inventories, net 442.3 367.2 Other current assets 100.6 88.2 Total current assets 1,509.3 1,400.9 Property, net 958.8 988.8 Goodwill 1,733.2 1,757.6 Intangible assets, net 1,396.3 1,492.4 Other non-current assets 347.8 385.9 Total assets $ 5,945.4 $ 6,025.6 LIABILITIES AND SHAREHOLDERS' EQUITY Current liabilities: Short-term and current portion of $ 0.4 $ 0.5 long-term debt Accounts payable 440.4 410.0 Accrued expenses and other current 439.7 435.8 liabilities Total current liabilities 880.5 846.3 Non-current liabilities: Long-term debt 1,826.8 1,922.6 Deferred income taxes 276.7 285.7 Other non-current 490.7 584.7 liabilities Total non-current 2,594.2 2,793.0 liabilities SHAREHOLDERS' EQUITY Avient shareholders’ equity 2,456.8 2,374.2 Noncontrolling interest 13.9 12.1 Total equity 2,470.7 2,386.3 Total liabilities and $ 5,945.4 $ 6,025.6 equity

Nine Months Ended September 30, Operating activities 2026 2025 ────────────────────────────────────────────────────────────────────────────── Net income $ 165.0 $ 66.4 Adjustments to reconcile net income to net cash provided by operating activities: Depreciation and amortization 143.9 138.8 Cloud-based enterprise resource planning — 71.6 system impairment Share-based compensation 6.6 6.9 expense Changes in assets and liabilities: Increase in accounts receivable -92.8 -66.4 Increase in inventories -80.5 -25.4 Increase (decrease) in accounts 34.5 -43.5 payable Increase (decrease) in environmental 1.7 -1.5 obligations Environmental insurance — 34.0 recovery (Decrease) increase in restructuring -20.6 4.1 obligations Increase (decrease) in incentive 14.6 -33.0 accruals Accrued expenses and other assets and 7.6 -18.2 liabilities, net Net cash provided by operating 180.0 133.8 activities Investing activities Capital expenditures -66.4 -64.2 Net cash used in investing -66.4 -64.2 activities Financing activities Cash dividends paid -75.7 -74.1 Payments on long-term -100.2 -100.2 borrowings Debt financing costs — -3.9 Other financing activities -2.6 -3.5 Net cash used in financing -178.5 -181.7 activities Effect of exchange rate changes 0.1 13.2 on cash Decrease in cash and cash -64.8 -98.9 equivalents Cash and cash equivalents at beginning 510.5 544.5 of year Cash and cash equivalents at end of $ 445.7 $ 445.6 period

(In millions) Operating income and earnings before interest, taxes, depreciation and amortization (EBITDA) at the segment level does not include: special items as defined in Attachment 3 ; corporate general and administration costs that are not allocated to segments; intersegment sales and profit eliminations; share- based compensation costs; and certain other items that are not included in the measure of segment profit and loss that is reported to and reviewed by the chief operating decision maker. These costs are included in Corporate .

(In millions, except per share data) Senior management uses operating income before special items to assess performance and allocate resources because senior management believes that this measure is most useful in understanding current profitability levels and how it may serve as a basis for future performance. In addition, operating income before the effect of special items is a component of Avient's annual incentive plans and is used in debt covenant computations. Senior management believes this measure is useful to investors because it allows for comparison to Avient's performance in prior periods without the effect of items that, by their nature, tend to obscure Avient's operating results due to the potential variability across periods based on timing, frequency and magnitude. Non-GAAP financial measures have limitations as analytical tools and should not be considered in isolation from, or solely as alternatives to, financial measures prepared in accordance with GAAP. Below is a reconciliation of these non-GAAP financial measures to their most directly comparable financial measures calculated and presented in accordance with GAAP. See Attachment 3 for a definition and summary of special items.

(1) The tax effect has been calculated using a blended statutory tax rate for the jurisdictions in which the amortization expense was recognized.

Year Ended Reconciliation to EBITDA and Adjusted December 31, EBITDA: 2025 ─────────────────────────────────────────────────────────────────── Net income from continuing operations – $ 83.6 GAAP Net income - GAAP as a percent of sales 2.6 % Income tax expense 28.1 Interest expense, net 98.6 Depreciation & amortization 185.9 EBITDA $ 396.2 Special items, before tax 152.2 Interest expense included in special -2.0 items Depreciation & amortization included in -1.8 special items Adjusted EBITDA $ 544.6 Adjusted EBITDA as a percent of sales 16.7 %

Year Ended December 31, 2025 ────────────────────────────────────────────────────────────────────────────── Reconciliation to Condensed Consolidated $ EPS(1) Statements of Income Net income attributable to Avient common $ 81.9 $ 0.89 shareholders Special items, after-tax (Table 116.4 1.27 B) Amortization expense, after-tax (Table 60.7 0.66 A) Adjusted net income / EPS $ 259.0 $ 2.82

(1) Per share amounts may not recalculate from figures presented herein due to rounding

Table B Year Ended Summary of Specials Items(3) December 31, 2025 ───────────────────────────────────────────────────────────────────────────── Impact on Cost of sales $ -42.6 Impact on Selling and administrative -116.7 Impact on operating income -159.3 Interest expense, net - financing costs -2.0 Pension and post-retirement 9.1 mark-to-market adjustments and other Impact on Other income, net 9.1 Impact on income before income taxes -152.2 Income tax benefit on above special 35.1 items(2) Tax adjustments(4) 0.9 Noncontrolling interest activity -0.2 Impact of special items on net income $ -116.4 Diluted earnings per common share impact $ -1.27 Weighted average shares used to compute adjusted earnings per share: Diluted 91.8

(2) The tax effect has been calculated using a blended statutory tax rate for the jurisdictions in which the special item or amortization expense was recognized, except when a jurisdiction is in a valuation allowance in which case no tax benefit is recognized.

(3) Special items include charges related to specific strategic initiatives or financial restructuring such as: consolidation of operations; debt extinguishment costs; costs incurred directly in relation to acquisitions or divestitures; employee separation costs resulting from personnel reduction programs, plant realignment costs, executive separation agreements; asset impairments; settlement gains or losses and mark-to-market adjustments associated with gains and losses on pension and other post-retirement benefit plans; environmental remediation costs, fines, penalties and related insurance recoveries related to facilities no longer owned or closed in prior years; gains and losses on facility or property sales or disposals; results of litigation, fines or penalties, where such litigation (or action relating to the fines or penalties) arose prior to the commencement of the performance period; one-time, non-recurring items; and the effect of changes in accounting principles or other such laws or provisions affecting reported results.

(4) Tax adjustments include the net tax impact from non-recurring income tax items and certain adjustments to uncertain tax position reserves and valuation allowances. 15

Full text with the tables
                                                                                
   NEWS RELEASE                                                                 
                                                                                
                                                                                
  FOR IMMEDIATE RELEASE                                                         
                                                                                
  Avient Announces Third Quarter 2026 Results Ahead of Expectations; Increases  
                     Full-Year Adjusted EPS Guidance Range                      
• Third quarter sales grew 10.5% to $891 million, driven by strong sales growth
in both business segments

• Third quarter GAAP EPS of $0.46 compared to $0.36 in the prior year quarter

• Third quarter adjusted EPS grew 23% over the prior year quarter to $0.86;
exceeded adjusted EPS guidance of $0.80, primarily driven by better-than-
expected sales growth

• Strong cash flow generation supported $50 million of debt repayment in the
third quarter bringing total year-to-date 2026 debt reduction to $100 million

• Increasing 2026 full year adjusted EPS guidance range to $3.22 to $3.32 from
previous guidance of $3.10 to $3.25; updated full year adjusted EPS guidance
range represents 14% to 18% growth over the prior year
CLEVELAND – November 4, 2026 – Avient Corporation (NYSE: AVNT), an innovator of
materials solutions, today announced its third quarter results for 2026. Third
quarter GAAP earnings per share (EPS) were $0.46 compared to $0.36 in the prior
year quarter.

In the third quarter 2026, sales grew 10.5% to $891 million, which included a
negative 0.1% impact from unfavorable foreign exchange. Excluding the impact of
foreign exchange, organic sales growth was 10.6%

The company noted that in the third quarter 2026, GAAP EPS includes special
items of $0.23 and intangible amortization expense of $0.17 compared to special
items of $0.17 and intangible amortization of $0.17 in the third quarter 2025
(see attachment 1).

Third quarter 2026 adjusted EPS was $0.86 compared to $0.70 in the prior year
quarter, reflecting 23% growth in adjusted EPS over the prior year quarter.

"Our teams delivered a strong third quarter, driven by sales growth across
nearly all our markets, in particular packaging, healthcare and building &
construction,” said Mike Frank, President and Chief Executive Officer, Avient
Corporation.
                                       1                                        
“Both operating segments contributed organic sales growth in the quarter, driven
by pricing, in combination with improving mix from new business gains and strong
demand for our growth vector technologies. Our strategy is delivering tangible
results by aligning Avient’s capabilities with high-growth secular trends and
advancing productivity initiatives that support top-line growth and margin
expansion. As a result, organic sales grew 10.6% and adjusted EBITDA margins
expanded by 80 basis points to 17.3%.” added Mr. Frank.
                                                                                
  2026 Outlook                                                                  
                                                                                
“Our teams continue to demonstrate their ability to stay nimble in managing a
volatile business environment while executing our strategy. Supported by our
year-to-date results and visibility into fourth quarter demand, we are narrowing
our full-year 2026 adjusted EBITDA guidance to $593 to $603 million and raising
our adjusted EPS guidance to $3.22 to $3.32, representing 9% to 11% adjusted
EBITDA growth and 14% to 18% adjusted EPS growth for the year,” said Joe Di
Salvo, Senior Vice President and Chief Financial Officer.

“Strong cash generation is allowing us to invest in growth while strengthening
our balance sheet. Year-to-date in 2026, we have repaid a total of $100 million
of debt, including $50 million repaid during the third quarter. We expect to end
2026 with net debt to adjusted EBITDA leverage ratio of 2.2x to 2.3x.
Additionally, subsequent to quarter end, we have repurchased shares for the
first time since 2022, repurchasing 281,000 shares for approximately $10.9
million. Going forward, I expect we will take a balanced approach to deploying
excess cash for further debt reduction and opportunistic share repurchases,"
said Mr. Di Salvo.

Mr. Frank added, "Since joining Avient, I have been impressed with our customer
focus, innovation capabilities and operational discipline. I believe there is
considerable opportunity to continue to drive profitable growth through
enhancing our market penetration in key growth segments, as well as increasing
share and value in our core markets. Disciplined capital allocation will also be
a key area of focus as we continue to strengthen our balance sheet. I expect to
continue to build on the momentum we have created this year, while accelerating
our mission to materialize a brighter future.”
                                       2                                        
                                                                                
  Webcast Details                                                               
                                                                                
Avient will provide additional details on its 2026 third quarter and its 2026
full year outlook during its webcast scheduled for 8:00 a.m. Eastern Time on
November 4, 2026.

The webcast can be viewed live at avient.com/investors , or by clicking on the
webcast link here . Conference call participants in the question and answer
session should pre-register using the link at avient.com/investors , or here ,
to receive the dial-in number and personal PIN. This information is required to
access the conference call. The question-and-answer session will follow the
company’s presentation and prepared remarks.

A recording of the webcast and the slide presentation will be available at
avient.com/investors/events-presentations immediately following the conference
call and will be accessible for one year.
                                       3                                        
                                                                                
  Non-GAAP Financial Measures                                                   
                                                                                
The Company uses both GAAP (generally accepted accounting principles) and non-
GAAP financial measures. The non-GAAP financial measures include organic
performance (which excludes the impact of foreign exchange), adjusted EPS,
adjusted operating income, adjusted EBITDA, adjusted EBITDA margins, free cash
flow and adjusted free cash flow. Avient's chief operating decision maker uses
these financial measures to monitor and evaluate the ongoing performance of the
Company and each business segment and to allocate resources.

The Company does not provide reconciliations of forward-looking non-GAAP
financial measures, such as adjusted EPS, adjusted EBITDA and free cash flow, to
the most comparable GAAP financial measures on a forward-looking basis because
the Company is unable to provide a meaningful or accurate calculation or
estimation of reconciling items, and the information is not available without
unreasonable effort. This is due to the inherent difficulty of forecasting the
timing and amount of certain items, such as, but not limited to, environmental
remediation costs and associated recoveries, mark-to-market adjustments on
pension and other post-retirement obligations, acquisition-related charges, and
other non-routine costs. Each of such adjustments has not yet occurred, are out
of the Company's control and/or cannot be reasonably predicted. For the same
reasons, the Company is unable to address the probable significance of the
unavailable information.

To access Avient’s news library online, please visit www.avient.com/news .
                                                                                
  About Avient                                                                  
                                                                                
Our purpose at Avient Corporation (NYSE: AVNT) is to be an innovator of
materials solutions that help our customers succeed, while enabling a
sustainable world. Our local touch and customer engagement, combined with our
global presence, allows us to serve customers with agility. We harness the
collective strength of more than 9,000 employees worldwide to collaborate and
build on each other's ideas. In doing so, we innovate solutions that help our
customers overcome their challenges or capitalize on opportunities provided by
the fast-changing world and secular trends. Our expanding portfolio of offerings
includes colorants, advanced composites, functional additives, engineered
materials, and Dyneema®, the world’s strongest fiber™. By intersecting our broad
portfolio of technologies with the product roadmaps of our customers, we help
create differentiated and high-performance products that make the world better
and more sustainable. Visit www.avient.com to learn more.
                                       4                                        
                                                                                
  Forward-looking Statements                                                    
                                                                                
In this press release, statements that are not reported financial results or
other historical information are "forward-looking statements" within the meaning
of the Private Securities Litigation Reform Act of 1995. Forward-looking
statements give current expectations or forecasts of future events and are not
guarantees of future performance. They are based on management's expectations
that involve a number of business risks and uncertainties, any of which could
cause actual results to differ materially from those expressed in or implied by
the forward-looking statements. They use words such as "will," "anticipate,"
"estimate," "expect," "project," "intend," "plan," "believe," and other words
and terms of similar meaning in connection with any discussion of future
operating or financial condition, performance and/or sales. Factors that could
cause actual results to differ materially from those implied by these forward-
looking statements include, but are not limited to: disruptions, uncertainty or
volatility in the global credit markets that could adversely impact the
availability of credit already arranged and the availability and cost of credit
in the future; the effect on foreign operations of currency fluctuations,
tariffs and other political, economic and regulatory risks; disruptions or
inefficiencies in our supply chain, logistics, or operations; changes in laws
and regulations in jurisdictions where we conduct business, including with
respect to plastics and climate change; changes to foreign trade policy,
including new or increased tariffs and changing import/export regulation;
fluctuations in raw material prices, quality and supply, and in energy prices
and supply; demand for our products and services; production outages or material
costs associated with scheduled or unscheduled maintenance programs;
unanticipated developments that could occur with respect to contingencies such
as litigation and environmental matters; our ability to pay regular quarterly
cash dividends and the amounts and timing of any future dividends; information
systems failures, cybersecurity breaches and cyberattacks; our ability to
service our indebtedness and restrictions on our current and future operations
due to our indebtedness; amounts for cash and non-cash charges related to
restructuring plans that may differ from original estimates, including because
of timing changes associated with the underlying actions; and other factors
affecting our business beyond our control, including without limitation, changes
in the general economy, changes in interest rates, changes in the rate of
inflation, geopolitical conflicts and any recessionary conditions. The above
list of factors is not exhaustive.

Any forward-looking statement speaks only as of the date on which such statement
is made, and we undertake no obligation to publicly update forward-looking
statements, whether as a result of new information, future events or otherwise.
You are advised to consult any further disclosures we make on related subjects
in our reports on Form 10-Q, 8-K and 10-K that we provide to the Securities and
Exchange Commission.
                                       5                                        
Investor Relations Contact:
George T. Clark

Director of Investor Relations

440-930-1921

[email protected]
Media Contact:

Tatiana Marshall

Sr. Global Communications Leader

216-905-7211

[email protected]
                                       6                                        
                                                                                
  Attachment 1                                                                  
                                                                                
                                                                                
                               Avient Corporation                               
                                                                                
    Reconciliation of Adjusted Net Income and Earnings Per Share (Unaudited)    
                                                                                
                      (In millions, except per share data)                      
Senior management uses comparisons of adjusted net income attributable to Avient
common shareholders and diluted adjusted earnings per share (EPS) attributable
to Avient common shareholders, excluding special items, to assess performance
and facilitate comparability of results. Further, as a result of Avient's
strategic shift towards an innovator of materials solutions, it has completed
several acquisitions and divestitures which have resulted in a significant
amount of intangible asset amortization. Management excludes intangible asset
amortization from adjusted EPS as it believes excluding acquired intangible
asset amortization is a useful measure of current period earnings per share.
Senior management believes these measures are useful to investors because they
allow for comparison to Avient's performance in prior periods without the effect
of items that, by their nature, tend to obscure Avient's operating results due
to the potential variability across periods based on timing, frequency and
magnitude. Non-GAAP financial measures have limitations as analytical tools and
should not be considered in isolation from, or solely as alternatives to,
financial measures prepared in accordance with GAAP. Below is a reconciliation
of these non-GAAP financial measures to their most directly comparable financial
measures calculated and presented in accordance with GAAP. See Attachment 3 for
a definition and summary of special items.
                                                                                
                 Three Months                                                   
                 Ended                                                          
                 September                                                      
                 30,           2026                       2025                  
 ────────────────────────────────────────────────────────────────────────────── 
  Reconcilia…                                                                   
  to                                                                            
  Condensed      $                     EPS(1)          $          EPS(1)        
  Consolidat…                                                                   
  Statements                                                                    
  of Income                                                                     
  Net income                                                                    
  attributab…                                                                   
  to Avient      $             42.7    $       0.46    $  32.6    $       0.36  
  common                                                                        
  shareholde…                                                                   
  Special                                                                       
  items,                                                                        
  after-tax                    21.1            0.23       15.7            0.17  
  (Attachment                                                                   
  3)                                                                            
  Amortizati…                                                                   
  expense,                                                                      
  after-tax                    15.7            0.17       15.9            0.17  
  (Attachment                                                                   
  7)                                                                            
  Adjusted                                                                      
  net income     $             79.5    $       0.86    $  64.2    $       0.70  
  / EPS                                                                         
                                                                                
(1) Per share amounts may not recalculate from figures presented herein due to
rounding
                                                                                
                Nine Months                                                     
                Ended                                                           
                September                                                       
                30,           2026                        2025                  
 ────────────────────────────────────────────────────────────────────────────── 
  Reconcili…                                                                    
  to                                                                            
  Condensed     $                     EPS(1)          $           EPS(1)        
  Consolida…                                                                    
  Statements                                                                    
  of Income                                                                     
  Net income                                                                    
  attributa…                                                                    
  to Avient     $            163.2    $       1.77    $   65.0    $       0.71  
  common                                                                        
  sharehold…                                                                    
  Special                                                                       
  items,                                                                        
  after-tax                   34.8            0.38        97.1            1.06  
  (Attachme…                                                                    
  3)                                                                            
  Amortizat…                                                                    
  expense,                                                                      
  after-tax                   46.5            0.50        45.6            0.49  
  (Attachme…                                                                    
  7)                                                                            
  Adjusted                                                                      
  net income    $            244.5    $       2.65    $  207.7    $       2.26  
  / EPS                                                                         
                                                                                
(1) Per share amounts may not recalculate from figures presented herein due to
rounding
                                       7                                        
                                                                                
  Attachment 2                                                                  
                                                                                
                                                                                
                               Avient Corporation                               
                                                                                
            Condensed Consolidated Statements of Income (Unaudited)             
                                                                                
                      (In millions, except per share data)                      
                                                                                
                      Three                              Nine                   
                     Months                            Months                   
                      Ended                             Ended                   
                   Septemb…                          Septemb…                   
             2026       30,    2025            2026       30,    2025           
 ────────────────────────────────────────────────────────────────────────────── 
  Sales      $        891.2    $      806.5    $      2,655.6    $     2,499.6  
  Cost of             619.4           561.6           1,803.6          1,713.6  
  sales                                                                         
  Gross               271.8           244.9             852.0            786.0  
  margin                                                                        
  Selling                                                                       
  and                 189.2           177.8             561.2            622.1  
  admini…                                                                       
  expense                                                                       
  Operat…              82.6            67.1             290.8            163.9  
  income                                                                        
  Intere…                                                                       
  expens…             -22.7           -24.2             -67.0            -75.8  
  net                                                                           
  Other                                                                         
  expens…              -1.4               —              -3.9             -0.9  
  net                                                                           
  Income                                                                        
  before               58.5            42.9             219.9             87.2  
  income                                                                        
  taxes                                                                         
  Income                                                                        
  tax                 -15.0           -10.1             -54.9            -20.8  
  expense                                                                       
  Net        $         43.5    $       32.8    $        165.0    $        66.4  
  income                                                                        
  Net                                                                           
  income                                                                        
  attrib…              -0.8            -0.2              -1.8             -1.4  
  to                                                                            
  noncon…                                                                       
  intere…                                                                       
  Net                                                                           
  income                                                                        
  attrib…                                                                       
  to         $         42.7    $       32.6    $        163.2    $        65.0  
  Avient                                                                        
  common                                                                        
  shareh…                                                                       
  Earnin…                                                                       
  per                                                                           
  share                                                                         
  attrib…                                                                       
  to         $         0.47    $       0.36    $         1.78    $        0.71  
  Avient                                                                        
  common                                                                        
  shareh…                                                                       
  -                                                                             
  Basic:                                                                        
  Earnin…                                                                       
  per                                                                           
  share                                                                         
  attrib…                                                                       
  to         $         0.46    $       0.36    $         1.77    $        0.71  
  Avient                                                                        
  common                                                                        
  shareh…                                                                       
  -                                                                             
  Dilute…                                                                       
  Cash                                                                          
  divide…                                                                       
  declar…                                                                       
  per        $       0.2750    $     0.2700    $       0.8250    $      0.8100  
  share                                                                         
  of                                                                            
  common                                                                        
  stock                                                                         
  Weight…                                                                       
  shares                                                                        
  used to                                                                       
  compute                                                                       
  earnin…                                                                       
  per                                                                           
  common                                                                        
  share:                                                                        
  Basic                91.7            91.6              91.7             91.5  
  Diluted              92.4            91.8              92.2             91.8  
                                                                                
                                       8                                        
                                                                                
  Attachment 3                                                                  
                                                                                
                                                                                
                               Avient Corporation                               
                                                                                
                                                                                
                      Summary of Special Items (Unaudited)                      
                                                                                
                      (In millions, except per share data)                      
                                                                                
             Three                             Nine                             
             Months                            Months                           
  Special    Ended                             Ended                            
  items(…    Septemb…                          Septemb…                         
  Cost of    30,                               30,                              
  sales:     2026               2025           2026               2025          
 ────────────────────────────────────────────────────────────────────────────── 
  Restru…                                                                       
  costs,                                                                        
  includ…    $          -5.6    $      -2.0    $         -10.4    $       -8.7  
  accele…                                                                       
  deprec…                                                                       
  Enviro…                                                                       
  remedi…              -19.1          -12.8              -27.7           -19.5  
  costs                                                                         
  Reimbu…                                                                       
  of                                                                            
  previo…                0.8            0.1                1.1             2.0  
  incurr…                                                                       
  enviro…                                                                       
  costs                                                                         
  Impact                                                                        
  on cost              -23.9          -14.7              -37.0           -26.2  
  of                                                                            
  sales                                                                         
  Selling                                                                       
  and                                                                           
  admini…                                                                       
  expens…                                                                       
  Restru…                                                                       
  and                                                                           
  employ…               -0.2           -4.0               -1.7           -11.8  
  separa…                                                                       
  costs                                                                         
  Legal                                                                         
  and                   -1.9           -0.7               -5.5            -1.6  
  other                                                                         
  Cloud-…                                                                       
  enterp…                                                                       
  resour…                  —              —                  —           -86.3  
  planni…                                                                       
  system                                                                        
  impair…                                                                       
  Impact                                                                        
  on                                                                            
  selling               -2.1           -4.7               -7.2           -99.7  
  and                                                                           
  admini…                                                                       
  expense                                                                       
  Impact                                                                        
  on                   -26.0          -19.4              -44.2          -125.9  
  operat…                                                                       
  income                                                                        
  Intere…                                                                       
  expens…                                                                       
  net -                    —              —                  —            -2.0  
  financ…                                                                       
  costs                                                                         
  Impact                                                                        
  on                                                                            
  income               -26.0          -19.4              -44.2          -127.9  
  before                                                                        
  income                                                                        
  taxes                                                                         
  Income                                                                        
  tax                                                                           
  benefit                5.2            3.7                9.0            30.8  
  on                                                                            
  special                                                                       
  items(…                                                                       
  Tax                   -0.3              —                0.4               —  
  adjust…                                                                       
  Impact                                                                        
  of                                                                            
  special    $         -21.1    $     -15.7    $         -34.8    $      -97.1  
  items                                                                         
  on net                                                                        
  income                                                                        
  Diluted                                                                       
  earnin…                                                                       
  per        $         -0.23    $     -0.17    $         -0.38    $      -1.06  
  common                                                                        
  share                                                                         
  impact                                                                        
  Weight…                                                                       
  average                                                                       
  shares                                                                        
  used to                                                                       
  compute                                                                       
  adjust…                                                                       
  earnin…                                                                       
  per                                                                           
  share:                                                                        
  Diluted               92.4           91.8               92.2            91.8  
                                                                                
(1) Special items include charges related to specific strategic initiatives or
financial restructuring such as: consolidation of operations; debt
extinguishment costs; costs incurred directly in relation to acquisitions or
divestitures; employee separation costs resulting from personnel reduction
programs, plant realignment costs, executive separation agreements; asset
impairments; settlement gains or losses and mark-to-market adjustments
associated with gains and losses on pension and other post-retirement benefit
plans; environmental remediation costs, fines, penalties and related insurance
recoveries related to facilities no longer owned or closed in prior years; gains
and losses on facility or property sales or disposals; results of litigation,
fines or penalties, where such litigation (or action relating to the fines or
penalties) arose prior to the commencement of the performance period; one-time,
non-recurring items; and the effect of changes in accounting principles or other
such laws or provisions affecting reported results.

(2) The tax effect has been calculated using a blended statutory tax rate for
the jurisdictions in which the special item was recognized, except when a
jurisdiction is in a valuation allowance in which case no tax benefit is
recognized.

(3) Tax adjustments include the net tax impact from non-recurring income tax
items and certain adjustments to uncertain tax position reserves and valuation
allowances.
                                       9                                        
                                                                                
  Attachment 4                                                                  
                                                                                
                                                                                
                               Avient Corporation                               
                                                                                
                                                                                
                     Condensed Consolidated Balance Sheets                      
                                                                                
                                 (In millions)                                  
                                                                                
                                           (Unaudited)                          
                                    September 30, 2026       December 31, 2025  
 ────────────────────────────────────────────────────────────────────────────── 
  ASSETS                                                                        
  Current assets:                                                               
  Cash and cash equivalents      $               445.7    $              510.5  
  Accounts receivable, net                       520.7                   435.0  
  Inventories, net                               442.3                   367.2  
  Other current assets                           100.6                    88.2  
  Total current assets                         1,509.3                 1,400.9  
  Property, net                                  958.8                   988.8  
  Goodwill                                     1,733.2                 1,757.6  
  Intangible assets, net                       1,396.3                 1,492.4  
  Other non-current assets                       347.8                   385.9  
  Total assets                   $             5,945.4    $            6,025.6  
  LIABILITIES AND                                                               
  SHAREHOLDERS' EQUITY                                                          
  Current liabilities:                                                          
  Short-term and current                                                        
  portion of                     $                 0.4    $                0.5  
  long-term debt                                                                
  Accounts payable                               440.4                   410.0  
  Accrued expenses and other                                                    
  current                                        439.7                   435.8  
  liabilities                                                                   
  Total current liabilities                      880.5                   846.3  
  Non-current liabilities:                                                      
  Long-term debt                               1,826.8                 1,922.6  
  Deferred income taxes                          276.7                   285.7  
  Other non-current                              490.7                   584.7  
  liabilities                                                                   
  Total non-current                            2,594.2                 2,793.0  
  liabilities                                                                   
  SHAREHOLDERS' EQUITY                                                          
  Avient shareholders’ equity                  2,456.8                 2,374.2  
  Noncontrolling interest                         13.9                    12.1  
  Total equity                                 2,470.7                 2,386.3  
  Total liabilities and          $             5,945.4    $            6,025.6  
  equity                                                                        
                                                                                
                                       10                                       
                                                                                
  Attachment 5                                                                  
                                                                                
                                                                                
                               Avient Corporation                               
                                                                                
          Condensed Consolidated Statements of Cash Flows (Unaudited)           
                                                                                
                                 (In millions)                                  
                                                                                
                                     Nine Months Ended                          
                                     September 30,                              
  Operating activities               2026                         2025          
 ────────────────────────────────────────────────────────────────────────────── 
  Net income                         $                   165.0    $       66.4  
  Adjustments to reconcile net                                                  
  income to                                                                     
  net cash provided by operating                                                
  activities:                                                                   
  Depreciation and amortization                          143.9           138.8  
  Cloud-based enterprise resource                                               
  planning                                                   —            71.6  
  system impairment                                                             
  Share-based compensation                                 6.6             6.9  
  expense                                                                       
  Changes in assets and                                                         
  liabilities:                                                                  
  Increase in accounts receivable                        -92.8           -66.4  
  Increase in inventories                                -80.5           -25.4  
  Increase (decrease) in accounts                         34.5           -43.5  
  payable                                                                       
  Increase (decrease) in                                                        
  environmental                                            1.7            -1.5  
  obligations                                                                   
  Environmental insurance                                    —            34.0  
  recovery                                                                      
  (Decrease) increase in                                                        
  restructuring                                          -20.6             4.1  
  obligations                                                                   
  Increase (decrease) in                                                        
  incentive                                               14.6           -33.0  
  accruals                                                                      
  Accrued expenses and other                                                    
  assets and                                               7.6           -18.2  
  liabilities, net                                                              
  Net cash provided by operating                         180.0           133.8  
  activities                                                                    
  Investing activities                                                          
  Capital expenditures                                   -66.4           -64.2  
  Net cash used in investing                             -66.4           -64.2  
  activities                                                                    
  Financing activities                                                          
  Cash dividends paid                                    -75.7           -74.1  
  Payments on long-term                                 -100.2          -100.2  
  borrowings                                                                    
  Debt financing costs                                       —            -3.9  
  Other financing activities                              -2.6            -3.5  
  Net cash used in financing                            -178.5          -181.7  
  activities                                                                    
  Effect of exchange rate changes                          0.1            13.2  
  on cash                                                                       
  Decrease in cash and cash                              -64.8           -98.9  
  equivalents                                                                   
  Cash and cash equivalents at                                                  
  beginning                                              510.5           544.5  
  of year                                                                       
  Cash and cash equivalents at                                                  
  end of                             $                   445.7    $      445.6  
  period                                                                        
                                                                                
                                       11                                       
                                                                                
  Attachment 6                                                                  
                                                                                
                                                                                
                               Avient Corporation                               
                                                                                
                                                                                
                    Business Segment Operations (Unaudited)                     
                                                                                
                                 (In millions)                                  
Operating income and earnings before interest, taxes, depreciation and
amortization (EBITDA) at the segment level does not include: special items as
defined in Attachment 3 ; corporate general and administration costs that are
not allocated to segments; intersegment sales and profit eliminations; share-
based compensation costs; and certain other items that are not included in the
measure of segment profit and loss that is reported to and reviewed by the chief
operating decision maker. These costs are included in Corporate .
                                                                                
            Three                            Nine                               
            Months                           Months                             
            Ended                            Ended                              
            Septem…                          Septem…                            
            30,                              30,                                
  Sales:    2026              2025           2026                2025           
 ────────────────────────────────────────────────────────────────────────────── 
  Color,                                                                        
  Addit…    $        551.5    $     509.9    $        1,653.8    $     1,568.2  
  and                                                                           
  Inks                                                                          
  Speci…                                                                        
  Engin…             340.6          297.7             1,004.7            935.8  
  Mater…                                                                        
  Corpo…              -0.9           -1.1                -2.9             -4.4  
  Sales     $        891.2    $     806.5    $        2,655.6    $     2,499.6  
  Gross                                                                         
  margi…                                                                        
  Color,                                                                        
  Addit…    $        189.1    $     168.8    $          573.0    $       529.9  
  and                                                                           
  Inks                                                                          
  Speci…                                                                        
  Engin…             107.0           91.0               316.9            282.6  
  Mater…                                                                        
  Corpo…             -24.3          -14.9               -37.9            -26.5  
  Gross     $        271.8    $     244.9    $          852.0    $       786.0  
  margin                                                                        
  Selli…                                                                        
  and                                                                           
  admin…                                                                        
  expen…                                                                        
  Color,                                                                        
  Addit…    $        100.4    $      95.0    $          301.1    $       287.2  
  and                                                                           
  Inks                                                                          
  Speci…                                                                        
  Engin…              57.3           53.7               167.1            158.0  
  Mater…                                                                        
  Corpo…              31.5           29.1                93.0            176.9  
  Selli…                                                                        
  and       $        189.2    $     177.8    $          561.2    $       622.1  
  admin…                                                                        
  expen…                                                                        
  Opera…                                                                        
  incom…                                                                        
  Color,                                                                        
  Addit…    $         88.7    $      73.8    $          271.9    $       242.7  
  and                                                                           
  Inks                                                                          
  Speci…                                                                        
  Engin…              49.7           37.3               149.8            124.6  
  Mater…                                                                        
  Corpo…             -55.8          -44.0              -130.9           -203.4  
  Opera…    $         82.6    $      67.1    $          290.8    $       163.9  
  income                                                                        
  Depre…                                                                        
  &                                                                             
  amort…                                                                        
  Color,                                                                        
  Addit…    $         22.4    $      22.6    $           67.5    $        66.7  
  and                                                                           
  Inks                                                                          
  Speci…                                                                        
  Engin…              23.0           22.0                68.7             65.9  
  Mater…                                                                        
  Corpo…               1.8            2.3                 7.7              6.2  
  Depre…                                                                        
  &         $         47.2    $      46.9    $          143.9    $       138.8  
  amort…                                                                        
  Earni…                                                                        
  before                                                                        
  inter…                                                                        
  taxes,                                                                        
  depre…                                                                        
  and                                                                           
  amort…                                                                        
  (EBIT…                                                                        
                                                                                
  Color,                                                                        
  Addit…    $        111.1    $      96.4    $          339.4    $       309.4  
  and                                                                           
  Inks                                                                          
  Speci…                                                                        
  Engin…              72.7           59.3               218.5            190.5  
  Mater…                                                                        
  Corpo…             -54.0          -41.7              -123.2           -197.2  
  Other                                                                         
  expen…              -1.4              —                -3.9             -0.9  
  net                                                                           
  EBITDA    $        128.4    $     114.0    $          430.8    $       301.8  
  Speci…                                                                        
  items,              26.0           19.4                44.2            127.9  
  before                                                                        
  tax                                                                           
  Inter…                                                                        
  expen…                                                                        
  inclu…                 —              —                   —             -2.0  
  in                                                                            
  speci…                                                                        
  items                                                                         
  Depre…                                                                        
  &                                                                             
  amort…                                                                        
  inclu…                 —           -0.5                -2.6             -1.2  
  in                                                                            
  speci…                                                                        
  items                                                                         
  Adjus…    $        154.4    $     132.9    $          472.4    $       426.5  
  EBITDA                                                                        
                                                                                
                                       12                                       
                                                                                
  Attachment 7                                                                  
                                                                                
                                                                                
                               Avient Corporation                               
                                                                                
                                                                                
           Reconciliation of Non-GAAP Financial Measures (Unaudited)            
                                                                                
                      (In millions, except per share data)                      
Senior management uses operating income before special items to assess
performance and allocate resources because senior management believes that this
measure is most useful in understanding current profitability levels and how it
may serve as a basis for future performance. In addition, operating income
before the effect of special items is a component of Avient's annual incentive
plans and is used in debt covenant computations. Senior management believes this
measure is useful to investors because it allows for comparison to Avient's
performance in prior periods without the effect of items that, by their nature,
tend to obscure Avient's operating results due to the potential variability
across periods based on timing, frequency and magnitude. Non-GAAP financial
measures have limitations as analytical tools and should not be considered in
isolation from, or solely as alternatives to, financial measures prepared in
accordance with GAAP. Below is a reconciliation of these non-GAAP financial
measures to their most directly comparable financial measures calculated and
presented in accordance with GAAP. See Attachment 3 for a definition and summary
of special items.
                                                                                
  Rec…                                                                          
  to                                                                            
  Con…          Three                                Nine                       
  Con…          Mont…                               Mont…                       
  Sta…          Ended                               Ended                       
  of            Sept…                               Sept…                       
  Inc…    2026    30,       2025              2026    30,       2025            
 ────────────────────────────────────────────────────────────────────────────── 
  Sal…                                                                          
  -       $     891.2       $     806.5       $     2,65…       $     2,49…     
  Sal…                                                                          
  Gro…                                                                          
  mar…          271.8             244.9             852.0             786.0     
  -                                                                             
  GAAP                                                                          
  Gro…                                                                          
  mar…                                                                          
  -                                                                             
  GAAP           30.5  %           30.4  %           32.1  %           31.4  %  
  as a                                                                          
  per…                                                                          
  of                                                                            
  sal…                                                                          
  Spe…                                                                          
  ite…                                                                          
  in                                                                            
  gro…           23.9              14.7              37.0              26.2     
  mar…                                                                          
  (At…                                                                          
  3)                                                                            
  Adj…                                                                          
  gro…    $     295.7       $     259.6       $     889.0       $     812.2     
  mar…                                                                          
  Adj…                                                                          
  gro…                                                                          
  mar…                                                                          
  as a           33.2  %           32.2  %           33.5  %           32.5  %  
  per…                                                                          
  of                                                                            
  sal…                                                                          
  Ope…                                                                          
  inc…    $      82.6       $      67.1       $     290.8       $     163.9     
  -                                                                             
  GAAP                                                                          
  Ope…                                                                          
  inc…                                                                          
  -                                                                             
  GAAP            9.3  %            8.3  %           11.0  %            6.6  %  
  as a                                                                          
  per…                                                                          
  of                                                                            
  sal…                                                                          
  Spe…                                                                          
  ite…                                                                          
  in                                                                            
  ope…           26.0              19.4              44.2             125.9     
  inc…                                                                          
  (At…                                                                          
  3)                                                                            
  Adj…                                                                          
  ope…    $     108.6       $      86.5       $     335.0       $     289.8     
  inc…                                                                          
  Adj…                                                                          
  ope…                                                                          
  inc…                                                                          
  as a           12.2  %           10.7  %           12.6  %           11.6  %  
  per…                                                                          
  of                                                                            
  sal…                                                                          
                                                                                
                                                                                
  Rec…                                                                          
  to            Three                                Nine                       
  EBI…          Mont…                               Mont…                       
  and           Ended                               Ended                       
  Adj…          Sept…                               Sept…                       
  EBI…    2026    30,       2025              2026    30,       2025            
 ────────────────────────────────────────────────────────────────────────────── 
  Net                                                                           
  inc…    $      43.5       $      32.8       $     165.0       $      66.4     
  -                                                                             
  GAAP                                                                          
  Net                                                                           
  inc…                                                                          
  -                                                                             
  GAAP            4.9  %            4.1  %            6.2  %            2.7  %  
  as a                                                                          
  per…                                                                          
  of                                                                            
  sal…                                                                          
  Inc…                                                                          
  tax     $      15.0       $      10.1       $      54.9       $      20.8     
  exp…                                                                          
  Int…           22.7              24.2              67.0              75.8     
  exp…                                                                          
  Dep…                                                                          
  and            47.2              46.9             143.9             138.8     
  amo…                                                                          
  EBI…    $     128.4       $     114.0       $     430.8       $     301.8     
  Spe…                                                                          
  ite…                                                                          
  bef…           26.0              19.4              44.2             127.9     
  tax                                                                           
  (At…                                                                          
  3)                                                                            
  Int…                                                                          
  exp…                                                                          
  inc…                                                                          
  in                —                 —                 —              -2.0     
  spe…                                                                          
  ite…                                                                          
  (At…                                                                          
  3)                                                                            
  Dep…                                                                          
  and                                                                           
  amo…                                                                          
  inc…              —              -0.5              -2.6              -1.2     
  in                                                                            
  spe…                                                                          
  ite…                                                                          
  Adj…    $     154.4       $     132.9       $     472.4       $     426.5     
  EBI…                                                                          
  Adj…                                                                          
  EBI…                                                                          
  as a           17.3  %           16.5  %           17.8  %           17.1  %  
  per…                                                                          
  of                                                                            
  sal…                                                                          
                                                                                
                                       13                                       
                                                                                
  Attachment 7                                                                  
                                                                                
                                                                                
        Thr…                                 Nine                               
        Mon…                                 Mon…                               
        End…                                 End…                               
        Sep…                                 Sep…                               
         30,                                  30,                               
  R…                                                                            
  of                                                                            
  T…    2026               20…               2026               20…             
  E…                                                                            
  on                                                                            
  A…                                                                            
  A…               20.4               20…               61.3               59…  
  e…                                                                            
  T…                                                                            
  e…                                                                            
  on                4.7               4.6               14.8               14…  
  a…                                                                            
  e…                                                                            
  A…                                                                            
  e…                                                                            
  n…       $  15…            $  15.9            $  46…            $  45.6       
  of                                                                            
  t…                                                                            
                                                                                
(1) The tax effect has been calculated using a blended statutory tax rate for
the jurisdictions in which the amortization expense was recognized.
                                                                     
                                             Year Ended              
  Reconciliation to EBITDA and Adjusted      December 31,            
  EBITDA:                                    2025                    
 ─────────────────────────────────────────────────────────────────── 
  Net income from continuing operations –    $              83.6     
  GAAP                                                               
  Net income - GAAP as a percent of sales                    2.6  %  
  Income tax expense                                        28.1     
  Interest expense, net                                     98.6     
  Depreciation & amortization                              185.9     
  EBITDA                                     $             396.2     
  Special items, before tax                                152.2     
  Interest expense included in special                      -2.0     
  items                                                              
  Depreciation & amortization included in                   -1.8     
  special items                                                      
  Adjusted EBITDA                            $             544.6     
  Adjusted EBITDA as a percent of sales                     16.7  %  
                                                                     
                                       14                                       
                                                                                
  Attachment 8                                                                  
                                                                                
                                                                                
                               Avient Corporation                               
                                                                                
       Reconciliation of Certain Non-GAAP Financial Measures (Unaudited)        
                                                                                
                      (In millions, except per share data)                      
                                                                                
                                      Year Ended                                
                                      December 31, 2025                         
 ────────────────────────────────────────────────────────────────────────────── 
  Reconciliation to Condensed                                                   
  Consolidated                        $                           EPS(1)        
  Statements of Income                                                          
  Net income attributable to                                                    
  Avient common                       $                   81.9    $       0.89  
  shareholders                                                                  
  Special items, after-tax (Table                        116.4            1.27  
  B)                                                                            
  Amortization expense, after-tax                                               
  (Table                                                  60.7            0.66  
  A)                                                                            
  Adjusted net income / EPS           $                  259.0    $       2.82  
                                                                                
(1) Per share amounts may not recalculate from figures presented herein due to
rounding
                                                                          
                                           Year Ended                     
  Table A                                  December 31, 2025              
 ──────────────────────────────────────────────────────────────────────── 
  Amortization expense                     $                  80.3        
  Tax effect on amortization expense(2)                             19.6  
  Amortization expense, net of tax         $                  60.7        
                                                                          
                                                                               
  Table B                                     Year Ended                       
  Summary of Specials Items(3)                December 31, 2025                
 ───────────────────────────────────────────────────────────────────────────── 
  Impact on Cost of sales                     $                   -42.6        
  Impact on Selling and administrative                           -116.7        
  Impact on operating income                                     -159.3        
  Interest expense, net - financing costs                          -2.0        
  Pension and post-retirement                                       9.1        
  mark-to-market adjustments and other                                         
  Impact on Other income, net                                       9.1        
  Impact on income before income taxes                           -152.2        
  Income tax benefit on above special                              35.1        
  items(2)                                                                     
  Tax adjustments(4)                                                0.9        
  Noncontrolling interest activity                                 -0.2        
  Impact of special items on net income       $                  -116.4        
  Diluted earnings per common share impact    $                   -1.27        
  Weighted average shares used to compute                                      
  adjusted earnings per share:                                                 
  Diluted                                                                91.8  
                                                                               
(2) The tax effect has been calculated using a blended statutory tax rate for
the jurisdictions in which the special item or amortization expense was
recognized, except when a jurisdiction is in a valuation allowance in which case
no tax benefit is recognized.

(3) Special items include charges related to specific strategic initiatives or
financial restructuring such as: consolidation of operations; debt
extinguishment costs; costs incurred directly in relation to acquisitions or
divestitures; employee separation costs resulting from personnel reduction
programs, plant realignment costs, executive separation agreements; asset
impairments; settlement gains or losses and mark-to-market adjustments
associated with gains and losses on pension and other post-retirement benefit
plans; environmental remediation costs, fines, penalties and related insurance
recoveries related to facilities no longer owned or closed in prior years; gains
and losses on facility or property sales or disposals; results of litigation,
fines or penalties, where such litigation (or action relating to the fines or
penalties) arose prior to the commencement of the performance period; one-time,
non-recurring items; and the effect of changes in accounting principles or other
such laws or provisions affecting reported results.

(4) Tax adjustments include the net tax impact from non-recurring income tax
items and certain adjustments to uncertain tax position reserves and valuation
allowances.
                                       15                                       

Sources

The 8-K item 2.02 filings (SEC EDGAR) and their EX-99 exhibits: the results release and, when filed, prepared remarks or the call transcript.

Also

Said vs did: the targets in these releases against what was then reported. Filings: every filing.

Work with it

Excel workbook · CSV. Google Sheet that stays up to date: paste =IMPORTDATA("https://tickdelta.com/company/AVNT/export.csv") into a cell.

Next:Presentations
Esc

Type a ticker such as AAPL, a name, an investor such as Buffett, or a topic such as tariffs. ↑ ↓ to move, Enter to open.