Cognex Corp CGNX
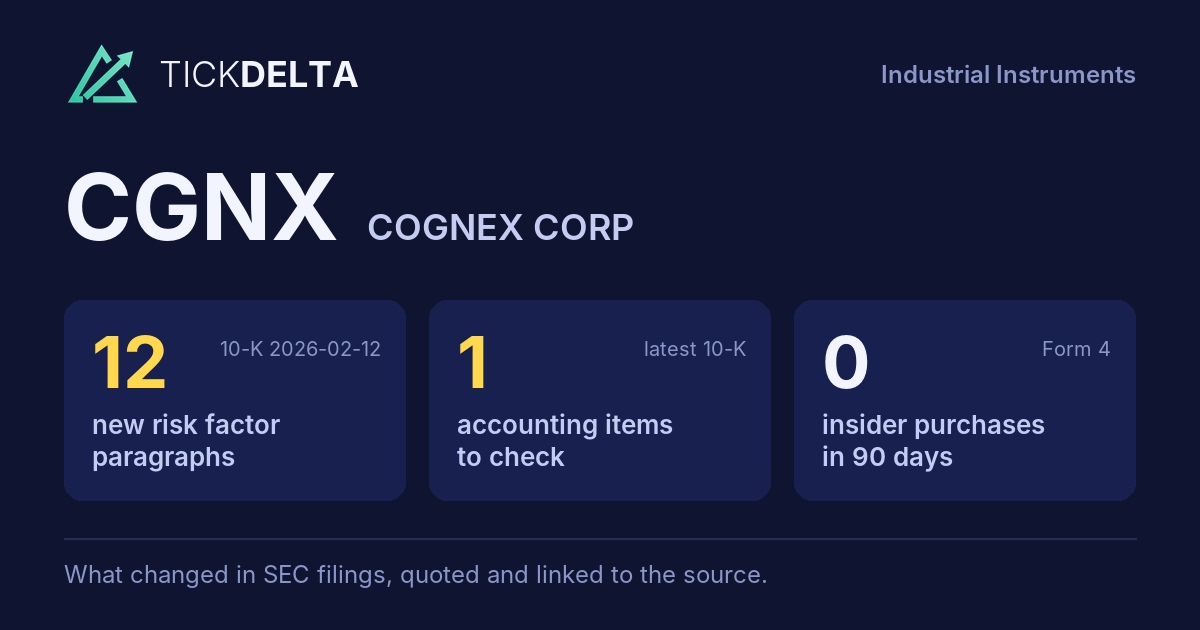
The biggest changes in the 10-K filed Feb 12, 2026, in management's words
10-K, Item 7This fiscal year against the last, and the sentences in the MD&A where management explains each change. Tickdelta picks sentences that name the line, a direction and a cause. It does not write explanations of its own.
Cash from operations
Big change, FY to Dec 31, 2025 vs Dec 31, 2024
“The increase in operating cash flow from the prior year was primarily driven by stronger business performance and optimization of working capital.”
Read it in the 10-K
Operating margin
Big change, FY to Dec 31, 2025 vs Dec 31, 2024
“Operating expenses decreased 2% over the prior year primarily due to savings from cost management, including headcount reductions.”
Read it in the 10-K
“Operating income increased to 16% of revenue in 2025 compared to 13% of revenue in 2024 due to the leverage achieved from revenue growth on lower operating expenses.”
Read it in the 10-K
Gross margin
Big change, FY to Dec 31, 2025 vs Dec 31, 2024
The MD&A has no sentence that names a cause for this change.
Revenue
Change, FY to Dec 31, 2025 vs Dec 31, 2024
“One-time revenue from our new strategic channel partnership mentioned above, which primarily impacted the Americas region, also contributed to the increase.”
Read it in the 10-K
Net income
Change, FY to Dec 31, 2025 vs Dec 31, 2024
“Net income as a percentage of revenue remained flat, as the operating leverage was offset by an increase in income tax expense driven by a $33 million discrete tax expense accrued in 2025 in connection with the enactment of United States tax legislation known as the One Big Beautiful Bill Act ("OBBBA") (refer to Note 18 to the Consolidated Financial Statements).”
Read it in the 10-K
“Other income (expense) increased by $6,446,000 from the prior year primarily due to a $5,053,000 gain on the sale of the 19,000 square-foot building adjacent to our corporate headquarters and the underlying land.”
Read it in the 10-K
What management said, year by year
The cause given in each 10-K, 2 fiscal years, newest first · MD&A (Item 7)
Each bar is how the line changed that year (from the same 10-K's XBRL). Under it, the sentence in that year's MD&A that names the line, a direction and a cause, word for word. A year with no sentence says so.
Revenue
2 of 2 years explained-
FY 2025 +8.7%
“One-time revenue from our new strategic channel partnership mentioned above, which primarily impacted the Americas region, also contributed to the increase.”
Read it in the FY 2025 10-K -
FY 2024 +9.2%
“Excluding the contribution of Moritex, revenue increased by 1% in 2024 over the prior year due to higher revenue from customers in the logistics and semiconductor industries, partially offset by lower revenue from customers in the automotive industry and softness across our broader factory automation business.”
Read it in the FY 2024 10-K“Revenue from the logistics industry represented approximately 23% of total revenue in 2024 and increased by 20% from the prior year due to investment by e-commerce customers.”
Read it in the FY 2024 10-K
Gross margin
0 of 2 years explained-
FY 2025 -1.5 pts
The FY 2025 MD&A has no sentence that names a cause for this change.
-
FY 2024 -3.4 pts
The FY 2024 MD&A has no sentence that names a cause for this change.
Operating margin
2 of 2 years explained-
FY 2025 +3.8 pts
“Operating expenses decreased 2% over the prior year primarily due to savings from cost management, including headcount reductions.”
Read it in the FY 2025 10-K“Operating income increased to 16% of revenue in 2025 compared to 13% of revenue in 2024 due to the leverage achieved from revenue growth on lower operating expenses.”
Read it in the FY 2025 10-K -
FY 2024 -3.0 pts
“Operating income decreased to 13% of revenue in 2024 compared to 16% of revenue in 2023 driven by the lower gross margin percentage.”
Read it in the FY 2024 10-K
Net income
1 of 2 years explained-
FY 2025 +7.8%
“Net income as a percentage of revenue remained flat, as the operating leverage was offset by an increase in income tax expense driven by a $33 million discrete tax expense accrued in 2025 in connection with the enactment of United States tax legislation known as the One Big Beautiful Bill Act ("OBBBA") (refer to Note 18 to the Consolidated Financial Statements).”
Read it in the FY 2025 10-K“Other income (expense) increased by $6,446,000 from the prior year primarily due to a $5,053,000 gain on the sale of the 19,000 square-foot building adjacent to our corporate headquarters and the underlying land.”
Read it in the FY 2025 10-K -
FY 2024 -6.2%
The FY 2024 MD&A has no sentence that names a cause for this change.
Cash from operations
1 of 2 years explained-
FY 2025 +64.7%
“The increase in operating cash flow from the prior year was primarily driven by stronger business performance and optimization of working capital.”
Read it in the FY 2025 10-K -
FY 2024 +32.0%
The FY 2024 MD&A has no sentence that names a cause for this change.
Changes are computed from the XBRL figures in the same 10-K. Hover a number to see the line item. Open the 10-K
Sources
The Management's Discussion and Analysis (Item 7) of the latest 10-K, quoted word for word; the changes are computed from the same 10-K's XBRL.
Also
Financials: the numbers year by year.
Work with it
Excel workbook · CSV. Google Sheet that stays up to date: paste =IMPORTDATA("https://tickdelta.com/company/CGNX/export.csv") into a cell.