Form 10-K for the fiscal year ended December 31, 2021
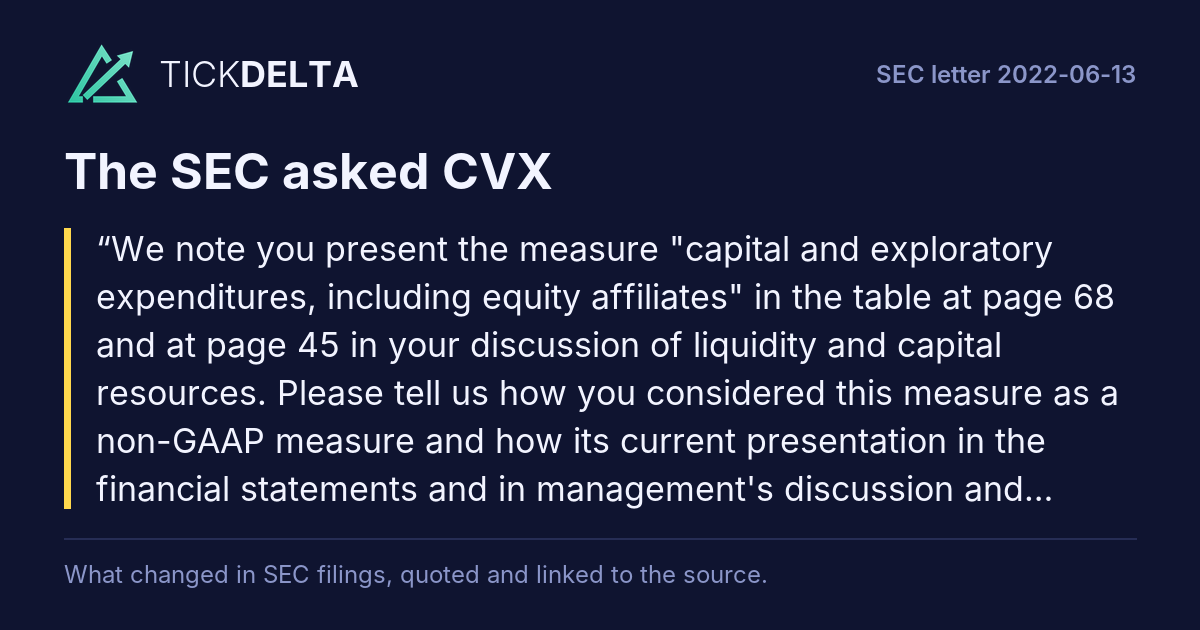
We note you present the measure "capital and exploratory expenditures, including equity affiliates" in the table at page 68 and at page 45 in your discussion of liquidity and capital resources. Please tell us how you considered this measure as a non-GAAP measure and how its current presentation in the financial statements and in management's discussion and analysis complies with Item 10(e) of Regulation S-K.Rest of the question
In this regard, we note that you apply the equity method of accounting to your equity affiliates and therefore own an interest in the investee as a whole rather than having a proportionate legal interest in each financial statement line item, like revenues or expenses. Reflecting these equity method investments using a proportionate consolidation method in a consolidated measure does not appear to be consistent with the guidance in Question 100.04 of the Non- GAAP Compliance and Disclosure Interpretations issued on May 17, 2016. In closing, we remind you that the company and its management are responsible for the accuracy and adequacy of their disclosures, notwithstanding any review, comments, action or absence of action by the staff.
We acknowledge the Staff’s comment and advise the Staff that we do not consider Capital and Exploratory Expenditures (“C&E”) to be a non-GAAP financial measure as defined in Item 10(e) of Regulation S-X; therefore, Question 100.04 of the Non-GAAP CDIs is not applicable. Rather, we consider Capital and Exploratory Expenditures, including equity affiliates (“Total C&E”), to be a key performance indicator (“KPI”).Read in the reply ↗Rest of the answer
We believe the presentation of this KPI is consistent with the Commission Guidance on Management’s Discussion and Analysis (“MD&A”) of Financial Condition and Results of Operation, effective February 25, 2020, that provides guidance on disclosure of KPIs and metrics in MD&A. However, as discussed below, we propose to enhance our disclosure in MD&A. Total C&E is an important metric used by the Company’s management, board of directors, and other key stakeholders that follow us and our industry.
No direct GAAP measure
There is no direct GAAP measure that captures the Company’s total investment level. Total C&E includes additions to properties, plant and equipment and investment and advances made by the Company (included as investing cash outflows in the consolidated Statement of Cash Flows) and exploration expenditures (included as operating cash flows in the consolidated Statement of Cash Flows) for the Company. Exploration expenditures are a key measure for companies with upstream operations and include seismic and other costs incurred at the early stages of an exploration program. The Company also includes its share of similar expenditures made by non-consolidated equity affiliates (not directly reflected in the Company’s financial statements) in Total C&E. Given that there is no comparable GAAP measure that provides a comprehensive view of the Company’s total investment plans and performance, we do not consider this metric to be a non-GAAP measure.
Total C&E is a Key Performance Indicator
Chevron determines Total C&E on an annual basis as part of the Company’s business plan, which is approved by the board of directors. Total C&E for the Company represents its proportionate share of C&E for both its consolidated and equity affiliate companies, and represents total capital reinvested in the business.1 Chevron manages and allocates capital at the portfolio level, which includes both its consolidated subsidiaries and equity affiliates. Management has flexibility and may reallocate capital within the annual budget cycle across businesses (i.e., for both consolidated subsidiaries and its equity affiliates). Equity affiliate C&E has a direct impact on funding requirements for the Company and its affiliates, and it impacts the cash available for dividends from the affiliate to the Company.
For example, Chevron has a 50-percent interest in a non-consolidated equity affiliate that has undertaken a multi-year, major capital project with spend of approximately $45 billion. The affiliate is funding this project from internally generated cash flows and loans; as a result, the affiliate has less cash available to dividend to Chevron. Therefore, while the funding for this project is not in the form of direct capital contributions from the Company to the affiliate, it is impacting the Company’s overall investments and cash flows. As a point of reference, affiliate spending has averaged 29 percent of Total C&E for Chevron over the last three years.
Total C&E is relied on by investors, analysts and rating agencies
Chevron believes that Total C&E provides investors with decision-useful information on the Company’s total investment and capital allocation plans that they are unable to otherwise obtain from the Company’s financial statements. It is also a measure that investors, analysts, and credit rating agencies monitor to assess the Company’s capital intensity, capital discipline and delivery on its financial priorities. With this KPI, stakeholders may evaluate the Company’s total capital spending relative to other sources and uses of cash—including those anticipated to and from affiliates—and observe our flexibility in adjusting spending levels as market conditions
1 Non-controlling interest ("NCI") is inconsequential and is therefore not excluded from consolidated figures. For example, in 2021, NCI was less than $5 million relative to Total C&E of $11.7 billion.
evolve to preserve cash flows, as occurred during the beginning of the COVID-19 pandemic in 2020. Investors, analysts and credit rating agencies are interested in the Company’s Total C&E program, as well as individual asset C&E, as this metric is frequently discussed in investor calls and cited in third party reports.
Prospective Filings
We believe the presentation of “Capital and exploratory expenditures, including equity affiliates” provides decision-useful information for investors for the reasons described above. In connection with responding to the Staff’s comment, we reviewed our disclosure and presented below, for illustrative purposes, is proposed disclosure (using the Company’s 2021 Form 10-K). The Company will endeavor to provide similar levels of disclosure to the below proposed disclosure in its future filings, starting with its Form 10-Q for the quarter ending June 30, 2022.
We will modify the information in Note 3 of the financial statements to only present the components that make up “capital expenditures” as presented on the face of the Consolidated Statement of Cash Flows. This information will exclude exploration costs that are expensed, assets acquired through finance lease obligations, and equity affiliate expenditures. The presentation that we will use in the annual and interim financial statements is presented below in Table 1.
Table 1
Year ended December 31
Millions of Dollars 2021 2020 2019
Additions to properties, plant and equipment $ 7,515 $ 8,492 $ 13,839
Additions to investments 460 136 140
Current-year dry hole expenditures 83 327 124
Payments for other assets and liabilities, net (2) (33) 13
Capital expenditures $ 8,056 $ 8,922 $ 14,116
Management’s Discussion and Analysis
Additionally, we propose to expand our discussion of Total C&E in our Liquidity and Capital Resources section of MD&A, consistent with the Commission Guidance effective February 25, 2020, to include a definition and calculation of this metric and statements as to how it provides useful information to investors and how management uses it to manage and monitor the performance of our business. Our additional disclosure will be similar to the following:
“Capital and exploratory expenditures, including equity affiliates (Total C&E), is a key performance indicator for the Company and provides a comprehensive view of its share of investment levels. This metric includes additions to fixed asset or investment accounts, or to exploration expense, for consolidated companies and our share of these expenditures by equity affiliates. Management uses this metric to manage allocation of capital across its entire portfolio, funding requirements and ultimately shareholder distributions.”
We also propose to add a new table to show the calculation of Total C&E, as illustrated in Table 2, and modify the existing Capital and Exploratory expenditures by business segment table as illustrated in Table 3.
Table 2
Expensed exploration expenditures 431 500 598
Assets acquired through finance leases and other obligations 64 53 181
Payments for other assets and liabilities, net 2 42 (13)
Capital and exploratory expenditures, excluding equity affiliates 8,553 9,517 14,882
Company’s share of expenditures by equity affiliates 3,167 3,982 6,112
Capital and exploratory expenditures, including equity affiliates $ 11,720 $ 13,499 $ 20,994
Table 3
2021 2020 2019
Millions of dollars U.S. Int’l. Total U.S. Int’l. Total U.S. Int’l. Total
Upstream $ 4,698 $ 4,916 $ 9,614 $ 5,130 $ 5,784 $ 10,914 $ 8,197 $ 9,627 $ 17,824
Downstream 1,235 630 1,865 1,021 1,325 2,346 1,868 920 2,788
All Other 221 20 241 226 13 239 365 17 382
Total C&E $ 6,154 $ 5,566 $ 11,720 $ 6,377 $ 7,122 $ 13,499 $ 10,430 $ 10,564 $ 20,994
If you wish to discuss or have any questions related to the information herein, please contact me or Mr. Amit Ghai, Assistant Controller, by telephone at (925) 842-1000.
First report after the company's reply of 2022-06-24: 10-Q filed 2022-08-04 ↗, against the 10-Q filed 2022-05-04 ↗.
Tickdelta does not hold the text of both reports, so they are not compared here.
We have considered your response to our prior comment. We note your measure of capital and exploratory expenditures, including equity affiliates, and do not agree with your conclusion that the measure is not a non-GAAP financial measure.Rest of the question
Further, we believe your presentation of this measure is contrary to Question 100.04 of our Non- GAAP Compliance and Disclosure Interpretations and therefore should not be disclosed. Please revise your disclosures to comply with the provisions of Item 10(e) of Regulation S-K and Question 100.04 of the Non-GAAP Compliance and Disclosure Interpretations.
The Company respectfully acknowledges the Staff’s comment and appreciates the opportunity to discuss with the Staff on September 14, 2022, the response previously provided by the Company in its letter dated June 24, 2022, with respect to the Staff’s prior comment. Consistent with such discussion, the Company agrees to no longer disclose the metric “Capital and Exploratory Expenditures, including equity affiliates” (formerly, “Total C&E”).
Chevron Corporation
6001 Bollinger Canyon Road, San Ramon, CA 94583-2324
Tel 925 842 3232
On a prospective basis, we will separately disclose the twoRead in the reply ↗Rest of the answer
key performance indicators (“KPIs”): “Capital and Exploratory Expenditures” (“C&E”), and “Equity affiliate Capital and Exploratory expenditures” (“Affiliate C&E”), which represents the Company’s share of expenditures by equity affiliates, in our Management’s Discussion and Analysis (“MD&A”) section.
Further to the above, we propose to expand our discussion of these KPIs in our Liquidity and Capital Resources section of MD&A in a manner substantially similar to the following:
Capital and exploratory expenditures (“C&E”) is a key performance indicator that provides the Company’s investment level in its consolidated companies. This metric includes additions to fixed asset and investment accounts along with exploration expense for its consolidated companies. Management uses this metric along with Affiliate C&E (as defined below) to manage allocation of capital across the company’s entire portfolio, funding requirements and ultimately shareholder distributions.
Equity affiliate capital and exploratory expenditures (“Affiliate C&E”) is a key performance indicator that provides the Company’s share of investments in its significant equity affiliate companies. This metric includes additions to fixed asset and investment accounts along with exploration expense in the equity affiliate companies’ financial statements. Management uses this metric to assess possible funding needs and/or shareholder distribution capacity of the company’s equity affiliate companies. Together with C&E, management also uses Affiliate C&E to manage allocation of capital across the company’s entire portfolio, funding requirements and ultimately shareholder distributions.
We also propose to present, on a prospective basis and in tabular format, the calculation of C&E, as illustrated in Table 1, and modify the existing Capital and Exploratory expenditures by business segment table, as illustrated in Table 2.
Table 1
Year ended December 31
Millions of Dollars 2021 2020 2019
Capital expenditures $ 8,056 $ 8,922 $ 14,116
Expensed exploration expenditures 431 500 598
Assets acquired through finance leases and other obligations 64 53 181
Payments for other assets and liabilities, net
2 42 (13)
Capital and exploratory expenditures (C&E)
$ 8,553 $ 9,517 $ 14,882
Affiliate capital and exploratory expenditures (Affiliate C&E)
$ 3,167 $ 3,982 $ 6,112
Table 2
Capital and Exploratory Expenditures:
2021 2020 2019
Millions of dollars U.S. Int’l. Total U.S. Int’l. Total U.S. Int’l. Total
Upstream $ 4,696 $ 2,512 $ 7,208 $ 5,130 $ 2,867 $ 7,997 $ 8,197 $ 4,446 $ 12,643
Downstream 870 234 1,104 697 584 1,281 1,501 357 1,858
All Other 221 20 241 226 13 239 364 17 381
C&E
$ 5,787 $ 2,766 $ 8,553 $ 6,053 $ 3,464 $ 9,517 $ 10,062 $ 4,820 $ 14,882
Affiliate Capital and Exploratory Expenditures:
Upstream $ 2 $ 2,404 $ 2,406 $ — $ 2,917 $ 2,917 $ — $ 5,181 $ 5,181
Downstream 365 396 761 324 741 1,065 367 563 930
All Other — — — — — — 1 — 1
Affiliate C&E
$ 367 $ 2,800 $ 3,167 $ 324 $ 3,658 $ 3,982 $ 368 $ 5,744 $ 6,112
If you wish to discuss or have any questions related to the information herein, please contact me or Mr. Amit Ghai, Assistant Controller, by telephone at (925) 842-1000.
First report after the company's reply of 2022-09-21: 10-Q filed 2022-11-03 ↗, against the 10-Q filed 2022-05-04 ↗.
Tickdelta does not hold the text of both reports, so they are not compared here.
Also in this review: closing letter, 2022-09-22