Entegris Inc ENTG
Entegris, Inc. (“Entegris”, “the Company”, “us”, “we”, or “our”) is a leading supplier of critical advanced materials and process solutions for the semiconductor and other high-technology industries. 10-K, Item 1
- Employees
- 7,700
- Headquarters
- Billerica, MA
- CEO
- David Reeder
- Next results
- around Feb 9, 2027
Where each dollar of revenue went, FY2025
Revenue of $3.2B through the costs to a net profit of $235.6M · income statement of the 10-K
ENTG among Materials peers
Six ratios from the latest 10-K. Each corner is the share of 84 peers the company is above, not a score.
What changed
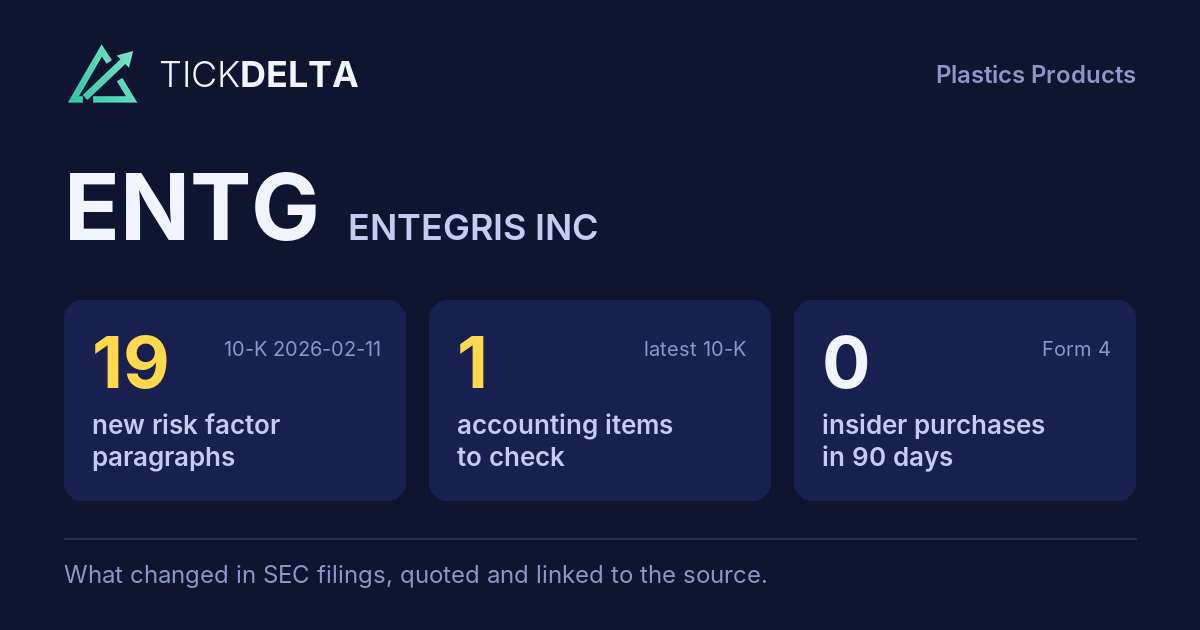
19 new risk paragraphs and 1 accounting fact worth reading about. 10-K filed Feb 11, 2026 against Feb 12, 2025.
Each row opens the detail with the quote and the filing. A row is a change worth reading, not a verdict.
Accounting checks
11 checks on the latest 10-K. Checks, not verdicts.
1fact worth reading about the other 10 checks found nothing to note
-
Critical audit matters changedNew this year: Evaluation of goodwill impairment for the MS reporting unit (“As discussed in Note 8 to the consolidated financial statements, the goodwill balance as of December 31, 2025 was $3.9 billion, $3.6 billion of which related to the Materials Solutions (MS) reporting unit. The Company performs goodwill impairment testing on an annual basis and whenever events or cha”). No longer listed: Annual impairment evaluation of the MS reporting unit
-
Receivables -7.4% ($495.3M to $458.7M) vs revenue -1.4% ($3.2B to $3.2B), -6.0 pts apart
9 more checks with nothing to note
-
Cash from operations $695.4M vs net income $235.6M (FY ending Dec 31, 2025)
-
Inventory +0.8% ($638.1M to $643.2M) vs revenue -1.4% ($3.2B to $3.2B), +2.2 pts apart
-
Same auditor in both 10-Ks: KPMG LLP
-
No statement of substantial doubt about going concern
-
No 8-K item 4.02 in the last 2 years
-
No NT 10-K or NT 10-Q in the last 2 years
-
No sentence in the 10-K concludes that controls were not effective because of a material weakness
-
No 8-K item 2.06 in the last 2 years
-
No 8-K item 1.03 in the last 2 years
In their words
19 paragraphs in Risk Factors that were not in the 10-K filed Feb 12, 2025. Quoted as filed.
-
Item 1A · new paragraph · not in the 10-K filed Feb 12, 2025 10-K, ITEM 1A
Our revenue is primarily dependent upon demand from the global semiconductor ecosystem. The semiconductor industry has historically been, and is likely to continue to be, cyclical with periodic downturns, resulting in decreased demand for our products, which has negatively impacted our results of operations in the past and could do so…
-
Item 1A · new paragraph · not in the 10-K filed Feb 12, 2025 10-K, ITEM 1A
These measures could also increase our costs (including logistics, compliance, and supplier qualification costs), disrupt our sourcing and manufacturing plans, and adversely affect our ability to meet customer requirements or contractual commitments.
-
Item 1A · new paragraph · not in the 10-K filed Feb 12, 2025 10-K, ITEM 1A
Sales to a limited number of large customers constitute a significant portion of our overall revenue, shipments, cash flows, collections and profitability and our success is tied in part to their competitive position in their respective markets. Our top ten customers accounted for 50%, 48% and 43% of our net sales in 2025, 2024 and…
-
Item 1A · new paragraph · not in the 10-K filed Feb 12, 2025 10-K, ITEM 1A
We continue to devote significant resources to network security, threat monitoring and other measures to protect our systems and data from unauthorized access or misuse, and we may be required to expend greater resources in the future, especially in the face of evolving and increasingly sophisticated cybersecurity threats and laws,…
New risk paragraphs, against peers
Latest 10-K of each, Materials companies closest in revenue
Paragraphs in Risk Factors with nothing like them in the company's 10-K the year before. A count of text, not of risk.
Financial performance
Last 4 fiscal years · 10-K XBRL
| Metric | FY2022 | FY2023 | FY2024 | FY2025 |
|---|---|---|---|---|
| Revenue | $3.3B | $3.5B | $3.2B | $3.2B |
| Net income | $208.9M | $180.7M | $292.8M | $235.6M |
| Operating cash flow | $363.1M | $644.5M | $631.7M | $695.4M |
| Free cash flow | −$103.1M | $187.7M | $316.1M | $396.2M |
Revenue, FY2016 to FY2025
Ten fiscal years, each from its own 10-K · XBRL · USD
$3.2B ▼ 1.4% in FY2025$235.6M ▼ 19.5% in FY2025$396.2M ▲ 25.3% in FY2025
Recent filings
3 filings in the last 30 days · SEC EDGAR
-
8-KNov 10, 2026Regulation FD disclosure, Other events 8-K items 7.01, 8.01
-
8-KOct 29, 2026Quarterly results 8-K item 2.02
-
10-QOct 29, 2026Quarterly report (10-Q) period ended Sep 26, 2026
About the company
Entegris Inc, Billerica, MA · from the 10-K filed Feb 11, 2026
Entegris, Inc. (“Entegris”, “the Company”, “us”, “we”, or “our”) is a leading supplier of critical advanced materials and process solutions for the semiconductor and other high-technology industries. We leverage our unique breadth of capabilities to provide customers with innovative, science-based solutions to their toughest technology challenges, helping improve productivity and product performance in the most advanced manufacturing environments.
- Headquarters
- Billerica, MA
- Country
- United States
- Reports in
- USD
- Listed on
- Nasdaq
- Fiscal year ends
- December 31
- Last results
- Oct 29, 2026
- Incorporated in
- DE
Employees, at the top of the page: "As of December 31, 2025, we had approximately 7,700 employees, of whom approximately 51%, 15%, 11%, 9%, 7%, 5% and 2% are located in North America, Southeast Asia, Taiwan, Japan, South Korea, China and Europe, respectively" (10-K). Address and exchange: SEC's company file.
Email alerts
Sources
The 10-K filed Feb 11, 2026 (open at SEC), compared with the 10-K filed Feb 12, 2025. Numbers from the XBRL of the 10-Ks; filings from SEC EDGAR.
Work with it: Excel workbook · CSV. Google Sheet that stays up to date: paste =IMPORTDATA("https://tickdelta.com/company/ENTG/export.csv") into a cell.