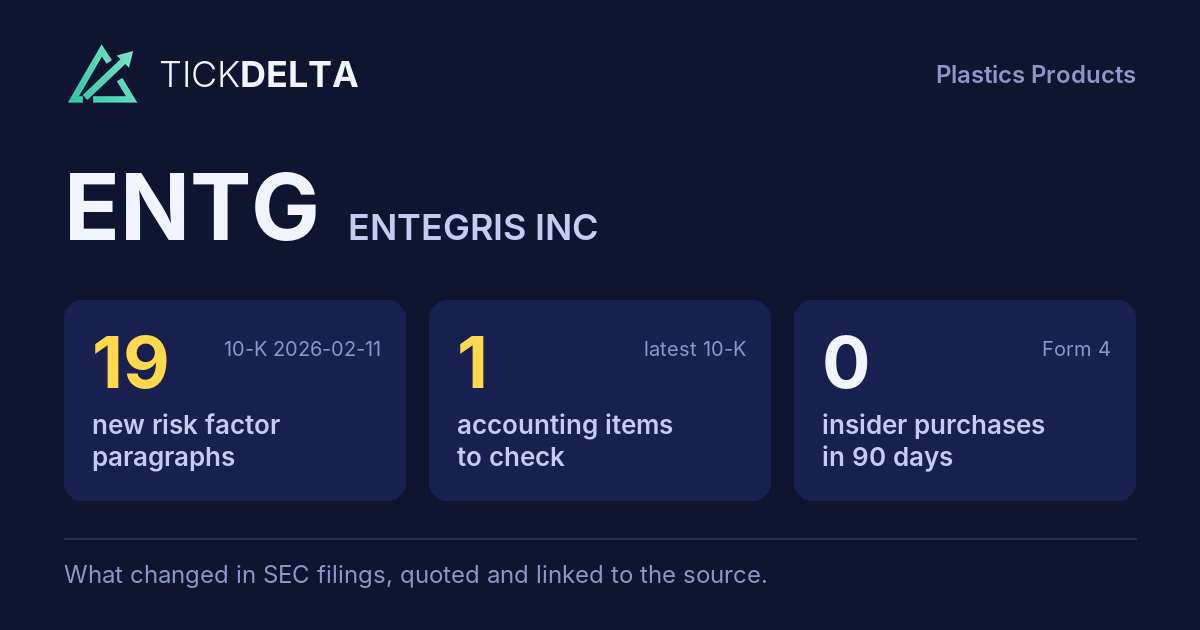
Screener / SEC EDGAR /CIK 0001101302 /10-K filed Feb 11, 2026, compared with Feb 12, 2025 /Numbers from the XBRL of the 10-Ks
Nasdaq Materials · Plastics Products

Entegris Inc ENTG

Compare with peers Embed
Earnings releases

Latest results release: Oct 29, 2026

8-K item 2.02, exhibit 99

What ENTG's management wrote with each quarter's results: the press release and, when the company files them, its prepared remarks or the call transcript. The call itself is not filed with SEC, so most quarters have the release only.

Adjusted vs GAAP earnings per share

In the company's own words · read from each release, never computed

In its release of Oct 29, 2026, ENTG reported $1.03 per share under GAAP and $1.23 on its own adjusted basis: the adjusted number is +19% above GAAP.

GAAP EPS $0.25, release Feb 13, 2024: Fourth-quarter GAAP diluted EPS of $0.25 Adjusted EPS $0.65, release Feb 13, 2024: Fourth-quarter non-GAAP diluted EPS of $0.65 BILLERICA, Mass., February 13, 2024 - Entegris , Inc. +160% 2024-02 GAAP EPS $0.30, release May 1, 2024: GAAP diluted EPS of $0.30 Adjusted EPS $0.68, release May 1, 2024: Non-GAAP diluted EPS of $0.68 BILLERICA, Mass., May 1, 2024 - Entegris, Inc. +127% 2024-05 GAAP EPS $0.45, release Jul 31, 2024: GAAP diluted EPS of $0.45 Adjusted EPS $0.71, release Jul 31, 2024: Non-GAAP diluted EPS of $0.71 BILLERICA, Mass., July 31, 2024 - Entegris, Inc. +58% 2024-07 GAAP EPS $0.51, release Nov 4, 2024: GAAP diluted EPS of $0.51. Adjusted EPS $0.77, release Nov 4, 2024: Non-GAAP diluted EPS of $0.77. +51% 2024-11 GAAP EPS $0.67, release Feb 6, 2025: GAAP diluted EPS of $0.67. Adjusted EPS $0.84, release Feb 6, 2025: Non-GAAP diluted EPS of $0.84. +25% 2025-02 GAAP EPS $0.41, release May 7, 2025: GAAP diluted EPS of $0.41. Adjusted EPS $0.67, release May 7, 2025: Non-GAAP diluted EPS of $0.67. +63% 2025-05 GAAP EPS $0.35, release Jul 30, 2025: GAAP diluted EPS of $0.35. Adjusted EPS $0.66, release Jul 30, 2025: Non-GAAP diluted EPS of $0.66. +89% 2025-07 GAAP EPS $0.46, release Oct 30, 2025: GAAP diluted EPS of $0.46. Adjusted EPS $0.72, release Oct 30, 2025: Non-GAAP diluted EPS of $0.72. +56% 2025-10 GAAP EPS $0.32, release Feb 10, 2026: GAAP diluted EPS of $0.32. Adjusted EPS $0.70, release Feb 10, 2026: Non-GAAP diluted EPS of $0.70. +119% 2026-02 GAAP EPS $0.60, release Apr 30, 2026: GAAP diluted EPS of $0.60. Adjusted EPS $0.86, release Apr 30, 2026: Non-GAAP diluted EPS of $0.86. +43% 2026-04 GAAP EPS $0.61, release Aug 4, 2026: GAAP diluted EPS of $0.61. Adjusted EPS $0.93, release Aug 4, 2026: Non-GAAP diluted EPS of $0.93. +52% 2026-08 GAAP EPS $1.03, release Oct 29, 2026: GAAP diluted EPS of $1.03. Adjusted EPS $1.23, release Oct 29, 2026: Non-GAAP diluted EPS of $1.23. +19% 2026-10
GAAP EPSAdjusted EPS, as the company defines itThe figure on top is how far adjusted is from GAAP. Click a bar for the sentence.
The company's words, latest release
GAAP diluted EPS of $1.03. release
Non-GAAP diluted EPS of $1.23. release

What the company says its adjusted numbers leave out:

The reconciliations of GAAP net sales to Adjusted Net Sales (excluding divestiture), GAAP gross profit to Adjusted Gross Profit, GAAP segment profit to Adjusted Operating Income, GAAP net income to Adjusted Operating Income and Adjusted EBITDA, GAAP net income and diluted earnings per common share to non-GAAP Net Income and diluted non-GAAP Earnings Per Common Share and GAAP outlook to non- GAAP outlook are included elsewhere in this release. release Oct 29, 2026

Both numbers are read from the words of each release (usually the highlights), never computed by us; hover a number for its sentence. Quarters where the release gives them only in a table are not shown. The company decides what "adjusted" leaves out; the full reconciliation is in the release.

Read and search

Every release, in full · linked to sec.gov

Press release Oct 29, 2026 · EX-99.1

Vice President, Investor Relations

Open on SEC

PRESS RELEASE Jeffrey Schnell Vice President, Investor Relations T + 1 201 207 3029 [email protected]

Entegris, Inc. (NASDAQ: ENTG), today reported its financial results for the Company’s third quarter ended September 26, 2026. Dave Reeder, Entegris’ President and Chief Executive Officer, said: “Entegris is executing well against an attractive long-term opportunity, driven by increasing semiconductor complexity, rising materials intensity, and investment in leading- edge technologies. Our ability to deliver the performance, quality, and reliability our customers require is helping us expand plans of record and secure new design wins, driving strong revenue growth across our unit and capex businesses. That growth, combined with disciplined execution, drove another strong quarter, highlighted by record revenue, continued margin expansion and strong earnings growth, all of which exceeded our guidance range. We also delivered record cash flow, enabling us to accelerate debt repayment and further strengthen our balance sheet. We look forward to discussing the significant opportunities ahead for Entegris and our long-term strategy in more detail at our Capital Markets Day on November 9, 2026.”

For the Company’s guidance for the fourth quarter ending December 31, 2026, the Company expects sales of $1,025 million to $1,055 million. The Company expects GAAP net income to be between $168 million and $181 million and diluted earnings per common share is expected to be between $1.09 and $1.17. On a non-GAAP basis, the Company expects diluted earnings per common share to range from $1.32 to $1.40, reflecting net income on a non-GAAP basis in the range of $203 million to $215 million. The Company also expects Adjusted EBITDA of approximately 30.7% to 31.2% of sales.

): MS provides materials-based solutions, such as chemical vapor and atomic layer deposition materials, chemical mechanical planarization slurries and pads, ion implantation specialty gases, formulated etch and clean materials, and other specialty materials that enable our customers to achieve better device performance and faster time to yield, while providing for lower total cost of ownership.

: APS offers filtration, purification and contamination-control solutions that improve customers’ yield, device reliability and cost by ensuring the purity of critical liquid chemistries and gases and the cleanliness of wafers and other substrates used throughout semiconductor manufacturing processes, the semiconductor ecosystem and other high-technology industries.

Entegris will hold a conference call to discuss its results for the third quarter on Thursday, October 29 2026, at 8:00 a.m. Eastern Time. Participants should dial 833-316-1983 or +1 785-838-9310, referencing confirmation ID: ENTGQ326. Participants are asked to dial in 10 minutes prior to the start of the call. For the live webcast and replay of the call, please Click Here.

Management’s slide presentation concerning the results for the third quarter will be posted on the Investor Relations section of www.entegris.com.

Entegris is a leading supplier of critical advanced materials and process solutions for the semiconductor and other high-technology industries. Entegris has approximately 7,700 employees throughout its global operations and is ISO 9001 certified. It has manufacturing, customer service and/or research facilities in the United States, Canada, China, Germany, Israel, Japan, Malaysia, Singapore, South Korea, and Taiwan. Additional information can be found at www.entegris.com.

The Company’s condensed consolidated financial statements are prepared in conformity with accounting principles generally accepted in the United States (GAAP). Adjusted Net Sales, Adjusted EBITDA, Adjusted Gross Profit, Adjusted Segment Profit, Adjusted Operating Income, non-GAAP Net Income, non-GAAP Adjusted Operating Margin and diluted non-GAAP Earnings Per Common Share, together with related measures thereof, are considered “non-GAAP financial measures” under the rules and regulations of the Securities and Exchange Commission. The presentation of this financial information is not intended to be considered in isolation or as a substitute for, or superior to, the financial information prepared and presented in accordance with GAAP. The Company provides supplemental non-GAAP financial measures to better understand and manage its business and believes these measures provide investors and analysts additional and meaningful information for the assessment of the Company’s ongoing results. Management also uses these non-GAAP measures to assist in the evaluation of the performance of its business segments and to make operating decisions. Management believes that the Company’s non-GAAP measures help indicate the Company’s baseline performance before certain gains, losses or other charges that may not be indicative of the Company’s business or future outlook, and that non-GAAP measures offer a more consistent view of business performance. The Company believes the non-GAAP measures aid investors’ overall understanding of the Company’s results by providing a higher degree of transparency for such items and providing a level of disclosure that will help investors generally understand how management plans, measures and evaluates the Company’s business performance. Management believes that the inclusion of non-GAAP measures provides greater consistency in its financial reporting and facilitates investors’ understanding of the Company’s historical operating trends by providing an additional basis for comparisons to prior periods. The reconciliations of GAAP net sales to Adjusted Net Sales (excluding divestiture), GAAP gross profit to Adjusted Gross Profit, GAAP segment profit to Adjusted Operating Income, GAAP net income to Adjusted Operating Income and Adjusted EBITDA, GAAP net income and diluted earnings per common share to non-GAAP Net Income and diluted non-GAAP Earnings Per Common Share and GAAP outlook to non- GAAP outlook are included elsewhere in this release. Entegris, Inc. - page 2 of 13

This news release contains “forward-looking statements”. The words “believe,” “expect,” “anticipate,” “intend,” “estimate,” “forecast,” “project,” “should,” “may,” “will,” “would” or the negative thereof and similar expressions are intended to identify such forward-looking statements. These forward-looking statements are based on current management expectations and assumptions only as of the date of this news release. They are not guarantees of future performance and they involve substantial risks and uncertainties that are difficult to predict and that could cause actual results to differ materially from the results expressed in, or implied by, these forward-looking statements. Some factors that could cause actual results to differ include, but are not limited to, fluctuations in demand for semiconductors and volume of semiconductor manufacturing; global economic uncertainty, including volatile financial markets, inflation and increased costs, trade wars, fluctuations in interest rates, economic recessions, and national debt and bank failures; supply chain risks, including partial reliance on sole, single or limited source suppliers; challenges inherent in operating a global business, including managing complex political, legal, regulatory, and operational environments across the jurisdictions in which the Company operates; the impact of export controls, economic sanctions and other similar restrictions; customer concentration; the need for continuing innovation and introduction of new products; manufacturing interruptions or delays and other operational disruptions; information technology system failures, network disruptions, data breaches, and other cybersecurity threats; the impact of tariffs and a volatile trade environment; the use of hazardous materials in the Company’s operations; goodwill impairment; loss of key employees; the Company’s ability to obtain, protect, and enforce intellectual property rights; the Company’s use, and its competitors’ use, of AI; environmental, social, and governance commitments; the impact of being subject to numerous rapidly evolving environmental laws and regulations across many jurisdictions; risks related to the regulatory environment, including compliance costs and being subject to potentially inconsistent or conflicting regulations; changes in taxation or adverse tax rulings; the impact of government incentives, including added operational complexity and competition; the impact of the Company’s indebtedness, including its ability to obtain future financing; risks related to the Company’s ability to generate sufficient cash to service its indebtedness; restrictions on the Company’s operations as a result of the terms of the Amended Credit Agreement and the Indentures; the volatility of the price of the Company’s common stock; changes in capital allocation strategy; provisions in the Company’s charter documents and Delaware law may delay or prevent the Company from being acquired; significant competition; the Company’s ability to successfully acquire or integrate other businesses, form joint ventures, or divest businesses; the impact of climate change, including changes in market dynamics and stakeholder expectations, and unexpected operational disruptions; and the other factors and additional information described in the Company’s Annual Report on Form 10-K for the fiscal year ended December 31, 2025, filed with the Securities and Exchange Commission (the “SEC”) on February 11, 2026, including under the heading “Risk Factors” in Part I, Item 1A, and in the Company’s other periodic filings with the SEC. Except as required under the federal securities laws and the rules and regulations of the SEC, the Company undertakes no obligation to update any forward-looking statements or information contained herein, which speak as of their respective dates. Entegris, Inc. - page 3 of 13

Nine months ended Sep 26, 2026 Sep 27, 2025 ────────────────────────────────────────────────────────────────────────────── Net sales $2,700.8 $2,372.7 Cost of 1,399.8 1,313.4 sales Gross profit 1,301.0 1,059.3 Selling, general and 380.6 320.2 administrat… expenses Engineering, research and 245.6 250.0 development expenses Amortization of 138.0 138.1 intangible assets Operating 536.8 351.0 income Interest 137.6 146.2 expense, net Other 9.4 5.3 expense, net Income before 389.8 199.5 income tax expense Income tax 46.2 12.5 expense Equity in net loss of 0.2 0.8 affiliates Net income $343.4 $186.2 Basic earnings per $2.25 $1.23 common share: Diluted earnings per $2.24 $1.22 common share: Weighted average shares outstanding: Basic 152.7 151.6 Diluted 153.6 152.1

Sep 26, 2026 Dec 31, 2025 ────────────────────────────────────────────────────────────────────────── ASSETS Current assets: Cash and cash equivalents $356.5 $360.4 Trade accounts and notes receivable, net 625.2 458.7 Inventories, net 769.0 643.2 Deferred tax charges and refundable 35.1 35.1 income taxes Other current assets 134.9 140.8 Total current assets 1,920.7 1,638.2 Property, plant and equipment, net 1,621.8 1,636.1 Right-of-use assets 111.5 108.7 Goodwill 3,950.0 3,946.7 Intangible assets, net 769.1 906.9 Deferred tax assets and other noncurrent 126.8 91.6 tax assets Other noncurrent assets 40.7 22.3 Total assets $8,540.6 $8,350.5 LIABILITIES AND EQUITY Current liabilities Accounts payable $262.4 $171.5 Accrued liabilities 404.2 234.7 Income taxes payable 55.5 82.4 Total current liabilities 722.1 488.6 Long-term debt 3,260.6 3,697.6 Long-term lease liabilities 100.4 98.6 Other liabilities 124.6 112.3 Shareholders’ equity 4,332.9 3,953.4 Total liabilities and equity $8,540.6 $8,350.5

(1) In the three months ended September 26, 2026, the Company received $8.3 million of refunds of International Emergency Economic Powers Act (IEEPA) tariffs that were recognized in cost of goods sold as incurred from April 2025 through February 2026 and were not excluded from the Company's non-GAAP results in those periods. The Company excluded the IEEPA tariff refunds from non-GAAP results because they represent a discrete, non-recurring, out-of-period recovery arising from a legal and regulatory development rather than ongoing operating performance.

(2) Restructuring charges resulting from discrete cost saving initiatives inclusive of employee termination benefit and asset impairment charges, primarily related to (i) an internal reorganization, combining two complementary divisions into one and realigning our customer-facing organization, (ii) workforce reductions and (iii) the planned wind-down of the Company’s Life Sciences Fluid Management business. Entegris, Inc. - page 9 of 13

(1) In the three months ended September 26, 2026, the Company received $8.3 million of refunds of International Emergency Economic Powers Act (IEEPA) tariffs that were recognized in cost of goods sold as incurred from April 2025 through February 2026 and were not excluded from the Company's non-GAAP results in those periods. The Company excluded the IEEPA tariff refunds from non-GAAP results because they represent a discrete, non-recurring, out-of-period recovery arising from a legal and regulatory development rather than ongoing operating performance.

(2) Restructuring charges resulting from discrete cost saving initiatives inclusive of employee termination benefit and asset impairment charges, primarily related to (i) an internal reorganization, combining two complementary divisions into one and realigning our customer-facing organization, (ii) workforce reductions and (iii) the planned wind-down of the Company’s Life Sciences Fluid Management business. Entegris, Inc. - page 10 of 13

Reconciliation of GAAP Net Income to Adjusted Operating Income and Adjusted EBITDA

(1) In the three months ended September 26, 2026, the Company received $8.3 million of refunds of International Emergency Economic Powers Act (IEEPA) tariffs that were recognized in cost of goods sold as incurred from April 2025 through February 2026 and were not excluded from the Company's non-GAAP results in those periods. The Company excluded the IEEPA tariff refunds from non-GAAP results because they represent a discrete, non-recurring, out-of-period recovery arising from a legal and regulatory development rather than ongoing operating performance.

(2) Restructuring charges resulting from discrete cost saving initiatives inclusive of employee termination benefit and asset impairment charges, primarily related to (i) an internal reorganization, combining two complementary divisions into one and realigning our customer-facing organization, (ii) workforce reductions and (iii) the planned wind-down of the Company’s Life Sciences Fluid Management business.

(3) Non-cash amortization expense associated with intangibles acquired in acquisitions. Entegris, Inc. - page 11 of 13

Reconciliation of GAAP Net Income and Diluted Earnings per Common Share to Non- GAAP Net Income and Diluted Non-GAAP Earnings per Common Share

(1) In the three months ended September 26, 2026, the Company received $8.3 million of refunds of International Emergency Economic Powers Act (IEEPA) tariffs that were recognized in cost of goods sold as incurred from April 2025 through February 2026 and were not excluded from the Company's non-GAAP results in those periods. The Company excluded the IEEPA tariff refunds from non-GAAP results because they represent a discrete, non-recurring, out-of-period recovery arising from a legal and regulatory development rather than ongoing operating performance.

(2) Restructuring charges resulting from discrete cost saving initiatives inclusive of employee termination benefit and asset impairment charges, primarily related to (i) an internal reorganization, combining two complementary divisions into one and realigning our customer-facing organization, (ii) workforce reductions and (iii) the planned wind-down of the Company’s Life Sciences Fluid Management business.

(3) Equity investment impairment loss in 2026 that reduced our carrying basis to zero.

(5) Non-cash amortization expense associated with intangibles acquired in acquisitions.

(6) The tax effect of pre-tax adjustments to net income was calculated using the applicable marginal tax rate for each respective year.

(7) As a result of displaying amounts in millions, the per-share components may not sum due to rounding. Entegris, Inc. - page 12 of 13

Reconciliation GAAP Operating Margin to non-GAAP Operating Margin and Adjusted Fourth Quarter December 31, EBITDA Margin Outlook 2026 ────────────────────────────────────────────────────────────────────────────── Net sales $1,025 - $1,055 GAAP - Operating income $235 - $250 Operating margin - as a % of net 23.0% - 23.7% sales Amortization of intangible assets 45 Adjusted operating income $281 - $295 Adjusted operating margin - as a % of 27.4% - 27.9% net sales Depreciation 34 Adjusted EBITDA $315- $329 Adjusted EBITDA - as a % of net sales 30.7% - 31.2%

Reconciliation GAAP net income to non-GAAP net Fourth Quarter Outlook income December 31, 2026 ────────────────────────────────────────────────────────────────────────────── GAAP net income $168 - $181 Adjustments to net income: Amortization of intangible assets 45 Income tax effect -11 Non-GAAP net income $203- $215

Reconciliation GAAP diluted earnings per share Fourth Quarter Outlook to non-GAAP diluted earnings per share December 31, 2026 ────────────────────────────────────────────────────────────────────────────── Diluted earnings per common share $1.09 - $1.17 Adjustments to earnings per share: Amortization of intangible assets 0.29 Income tax effect -0.06 Diluted non-GAAP earnings per common share $1.32 - $1.40 *As a result of displaying amounts in millions, rounding differences may exist in the tables.

Full text with the tables
                                      
  PRESS RELEASE                       
  Jeffrey Schnell                     
  Vice President, Investor Relations  
  T + 1 201 207 3029                  
  [email protected]        
                                      
                                                                    Exhibit 99.1
                                                                                
               ENTEGRIS REPORTS RESULTS FOR THIRD QUARTER OF 2026               
                                                                                
• Net sales of $1,006 million.
                                                                                
  •                                                                             
                                                                                
GAAP diluted EPS of $1.03.

• Non-GAAP diluted EPS of $1.23.
                                                                                
  BILLERICA, Mass., October 29, 2026 -                                          
                                                                                
Entegris, Inc. (NASDAQ: ENTG), today reported its financial results for the
Company’s third quarter ended September 26, 2026.
Dave Reeder, Entegris’ President and Chief Executive Officer, said: “Entegris is
executing well against an attractive long-term opportunity, driven by increasing
semiconductor complexity, rising materials intensity, and investment in leading-
edge technologies. Our ability to deliver the performance, quality, and
reliability our customers require is helping us expand plans of record and
secure new design wins, driving strong revenue growth across our unit and capex
businesses. That growth, combined with disciplined execution, drove another
strong quarter, highlighted by record revenue, continued margin expansion and
strong earnings growth, all of which exceeded our guidance range. We also
delivered record cash flow, enabling us to accelerate debt repayment and further
strengthen our balance sheet. We look forward to discussing the significant
opportunities ahead for Entegris and our long-term strategy in more detail at
our Capital Markets Day on November 9, 2026.”
                                                                                
  Quarterly Financial Results Summary                                           
                                                                                
(in millions, except percentages and per share data)
                                                                                
  GAAP                                                                 Jun 27,  
  Results              Sep 26, 2026          Sep 27, 2025                 2026  
 ────────────────────────────────────────────────────────────────────────────── 
  Net sales                $1,005.7                $807.1               $883.2  
  Gross                                                                         
  margin - as    49.7             %    43.5             %    47.6            %  
  a % of net                                                                    
  sales                                                                         
  Operating                                                                     
  margin - as    22.9             %    15.2             %    18.6            %  
  a % of net                                                                    
  sales                                                                         
  Net income                 $157.8                 $70.5                $93.6  
  Diluted                                                                       
  earnings                    $1.03                 $0.46                $0.61  
  per common                                                                    
  share                                                                         
  Non-GAAP             Sep 26, 2026          Sep 27, 2025              Jun 27,  
  Results                                                                 2026  
  Adjusted                                                                      
  gross                                                                         
  margin - as    48.9             %    43.6             %    47.6            %  
  a % of net                                                                    
  sales                                                                         
  Adjusted                                                                      
  operating                                                                     
  margin - as    26.8             %    21.1             %    24.5            %  
  a % of                                                                        
  net sales                                                                     
  Adjusted                                                                      
  EBITDA - as    30.2             %    27.3             %    28.4            %  
  a % of net                                                                    
  sales                                                                         
  Diluted                                                                       
  non-GAAP                                                                      
  earnings                    $1.23                 $0.72                $0.93  
  per common                                                                    
  share                                                                         
                                                                                
                                                                                
  Fourth Quarter of 2026 Outlook                                                
                                                                                
For the Company’s guidance for the fourth quarter ending December 31, 2026, the
Company expects sales of $1,025 million to $1,055 million. The Company expects
GAAP net income to be between $168 million and $181 million and diluted earnings
per common share is expected to be between $1.09 and $1.17. On a non-GAAP basis,
the Company expects diluted earnings per common share to range from $1.32 to
$1.40, reflecting net income on a non-GAAP basis in the range of $203 million to
$215 million. The Company also expects Adjusted EBITDA of approximately 30.7% to
31.2% of sales.
                                                                                
   Segment Results                                                              
                                                                                
The Company currently operates in two segments:
                                                                                
  Materials Solutions (MS                                                       
                                                                                
): MS provides materials-based solutions, such as chemical vapor and atomic
layer deposition materials, chemical mechanical planarization slurries and pads,
ion implantation specialty gases, formulated etch and clean materials, and other
specialty materials that enable our customers to achieve better device
performance and faster time to yield, while providing for lower total cost of
ownership.
                                                                                
  Advanced Purity Solutions (APS)                                               
                                                                                
: APS offers filtration, purification and contamination-control solutions that
improve customers’ yield, device reliability and cost by ensuring the purity of
critical liquid chemistries and gases and the cleanliness of wafers and other
substrates used throughout semiconductor manufacturing processes, the
semiconductor ecosystem and other high-technology industries.
                                                                                
  Third                                                                         
                                                                                
                                                                                
   Quarter Results Conference Call                                              
                                                                                
Entegris will hold a conference call to discuss its results for the third
quarter on Thursday, October 29 2026, at 8:00 a.m. Eastern Time. Participants
should dial 833-316-1983 or +1 785-838-9310, referencing confirmation ID:
ENTGQ326. Participants are asked to dial in 10 minutes prior to the start of the
call. For the live webcast and replay of the call, please Click Here.

Management’s slide presentation concerning the results for the third quarter
will be posted on the Investor Relations section of www.entegris.com.
                                                                                
  About Entegris                                                                
                                                                                
Entegris is a leading supplier of critical advanced materials and process
solutions for the semiconductor and other high-technology industries. Entegris
has approximately 7,700 employees throughout its global operations and is ISO
9001 certified. It has manufacturing, customer service and/or research
facilities in the United States, Canada, China, Germany, Israel, Japan,
Malaysia, Singapore, South Korea, and Taiwan. Additional information can be
found at www.entegris.com.
                                                                                
  Non-GAAP Information                                                          
                                                                                
The Company’s condensed consolidated financial statements are prepared in
conformity with accounting principles generally accepted in the United States
(GAAP). Adjusted Net Sales, Adjusted EBITDA, Adjusted Gross Profit, Adjusted
Segment Profit, Adjusted Operating Income, non-GAAP Net Income, non-GAAP
Adjusted Operating Margin and diluted non-GAAP Earnings Per Common Share,
together with related measures thereof, are considered “non-GAAP financial
measures” under the rules and regulations of the Securities and Exchange
Commission. The presentation of this financial information is not intended to be
considered in isolation or as a substitute for, or superior to, the financial
information prepared and presented in accordance with GAAP. The Company provides
supplemental non-GAAP financial measures to better understand and manage its
business and believes these measures provide investors and analysts additional
and meaningful information for the assessment of the Company’s ongoing results.
Management also uses these non-GAAP measures to assist in the evaluation of the
performance of its business segments and to make operating decisions. Management
believes that the Company’s non-GAAP measures help indicate the Company’s
baseline performance before certain gains, losses or other charges that may not
be indicative of the Company’s business or future outlook, and that non-GAAP
measures offer a more consistent view of business performance. The Company
believes the non-GAAP measures aid investors’ overall understanding of the
Company’s results by providing a higher degree of transparency for such items
and providing a level of disclosure that will help investors generally
understand how management plans, measures and evaluates the Company’s business
performance. Management believes that the inclusion of non-GAAP measures
provides greater consistency in its financial reporting and facilitates
investors’ understanding of the Company’s historical operating trends by
providing an additional basis for comparisons to prior periods. The
reconciliations of GAAP net sales to Adjusted Net Sales (excluding divestiture),
GAAP gross profit to Adjusted Gross Profit, GAAP segment profit to Adjusted
Operating Income, GAAP net income to Adjusted Operating Income and Adjusted
EBITDA, GAAP net income and diluted earnings per common share to non-GAAP Net
Income and diluted non-GAAP Earnings Per Common Share and GAAP outlook to non-
GAAP outlook are included elsewhere in this release.
                         Entegris, Inc. - page 2 of 13                          
                                                                                
  Cautionary Note on Forward-Looking Statements                                 
                                                                                
This news release contains “forward-looking statements”. The words “believe,”
“expect,” “anticipate,” “intend,” “estimate,” “forecast,” “project,” “should,”
“may,” “will,” “would” or the negative thereof and similar expressions are
intended to identify such forward-looking statements. These forward-looking
statements are based on current management expectations and assumptions only as
of the date of this news release. They are not guarantees of future performance
and they involve substantial risks and uncertainties that are difficult to
predict and that could cause actual results to differ materially from the
results expressed in, or implied by, these forward-looking statements. Some
factors that could cause actual results to differ include, but are not limited
to, fluctuations in demand for semiconductors and volume of semiconductor
manufacturing; global economic uncertainty, including volatile financial
markets, inflation and increased costs, trade wars, fluctuations in interest
rates, economic recessions, and national debt and bank failures; supply chain
risks, including partial reliance on sole, single or limited source suppliers;
challenges inherent in operating a global business, including managing complex
political, legal, regulatory, and operational environments across the
jurisdictions in which the Company operates; the impact of export controls,
economic sanctions and other similar restrictions; customer concentration; the
need for continuing innovation and introduction of new products; manufacturing
interruptions or delays and other operational disruptions; information
technology system failures, network disruptions, data breaches, and other
cybersecurity threats; the impact of tariffs and a volatile trade environment;
the use of hazardous materials in the Company’s operations; goodwill impairment;
loss of key employees; the Company’s ability to obtain, protect, and enforce
intellectual property rights; the Company’s use, and its competitors’ use, of
AI; environmental, social, and governance commitments; the impact of being
subject to numerous rapidly evolving environmental laws and regulations across
many jurisdictions; risks related to the regulatory environment, including
compliance costs and being subject to potentially inconsistent or conflicting
regulations; changes in taxation or adverse tax rulings; the impact of
government incentives, including added operational complexity and competition;
the impact of the Company’s indebtedness, including its ability to obtain future
financing; risks related to the Company’s ability to generate sufficient cash to
service its indebtedness; restrictions on the Company’s operations as a result
of the terms of the Amended Credit Agreement and the Indentures; the volatility
of the price of the Company’s common stock; changes in capital allocation
strategy; provisions in the Company’s charter documents and Delaware law may
delay or prevent the Company from being acquired; significant competition; the
Company’s ability to successfully acquire or integrate other businesses, form
joint ventures, or divest businesses; the impact of climate change, including
changes in market dynamics and stakeholder expectations, and unexpected
operational disruptions; and the other factors and additional information
described in the Company’s Annual Report on Form 10-K for the fiscal year ended
December 31, 2025, filed with the Securities and Exchange Commission (the “SEC”)
on February 11, 2026, including under the heading “Risk Factors” in Part I, Item
1A, and in the Company’s other periodic filings with the SEC. Except as required
under the federal securities laws and the rules and regulations of the SEC, the
Company undertakes no obligation to update any forward-looking statements or
information contained herein, which speak as of their respective dates.
                         Entegris, Inc. - page 3 of 13                          
                                                                                
                        Entegris, Inc. and Subsidiaries                         
                                                                                
                                                                                
                Condensed Consolidated Statements of Operations                 
                                                                                
                      (In millions, except per share data)                      
                                                                                
                                  (Unaudited)                                   
                                                                                
                 Three months                                                   
                 ended            Sep 26, 2026    Sep 27, 2025    Jun 27, 2026  
 ────────────────────────────────────────────────────────────────────────────── 
  Net sales                           $1,005.7          $807.1          $883.2  
  Cost of                                505.5           455.8           463.2  
  sales                                                                         
  Gross                                  500.2           351.3           420.0  
  profit                                                                        
  Selling,                                                                      
  general and                            136.5           101.8           126.5  
  administra…                                                                   
  expenses                                                                      
  Engineerin…                                                                   
  research                                                                      
  and                                     87.5            80.9            82.8  
  development                                                                   
  expenses                                                                      
  Amortizati…                                                                   
  of                                      45.6            46.0            46.1  
  intangible                                                                    
  assets                                                                        
  Operating                              230.6           122.6           164.6  
  income                                                                        
  Interest                                                                      
  expense,                                43.9            46.1            46.7  
  net                                                                           
  Other                                                                         
  expense                                  0.2             4.2             7.8  
  (income),                                                                     
  net                                                                           
  Income                                                                        
  before                                 186.5            72.3           110.1  
  income tax                                                                    
  expense                                                                       
  Income tax                              28.7             1.5            16.5  
  expense                                                                       
  Equity in                                                                     
  net loss of                                —             0.3               —  
  affiliates                                                                    
  Net income                            $157.8           $70.5           $93.6  
  Basic                                                                         
  earnings                               $1.03           $0.46           $0.61  
  per common                                                                    
  share                                                                         
  Diluted                                                                       
  earnings                               $1.03           $0.46           $0.61  
  per common                                                                    
  share                                                                         
  Weighted                                                                      
  average                                                                       
  shares                                                                        
  outstandin…                                                                   
  Basic                                  153.1           151.8           152.8  
  Diluted                                153.9           152.3           153.6  
                                                                                
                         Entegris, Inc. - page 4 of 13                          
                                                                                
                        Entegris, Inc. and Subsidiaries                         
                                                                                
                                                                                
                Condensed Consolidated Statements of Operations                 
                                                                                
                      (In millions, except per share data)                      
                                                                                
                                  (Unaudited)                                   
                                                                                
                  Nine months                                                   
                  ended                  Sep 26, 2026             Sep 27, 2025  
 ────────────────────────────────────────────────────────────────────────────── 
  Net sales                                  $2,700.8                 $2,372.7  
  Cost of                       1,399.8                  1,313.4                
  sales                                                                         
  Gross profit                  1,301.0                  1,059.3                
  Selling,                                                                      
  general and                     380.6                    320.2                
  administrat…                                                                  
  expenses                                                                      
  Engineering,                                                                  
  research and                    245.6                    250.0                
  development                                                                   
  expenses                                                                      
  Amortization                                                                  
  of                              138.0                    138.1                
  intangible                                                                    
  assets                                                                        
  Operating                       536.8                    351.0                
  income                                                                        
  Interest                        137.6                    146.2                
  expense, net                                                                  
  Other                             9.4                      5.3                
  expense, net                                                                  
  Income                                                                        
  before                          389.8                    199.5                
  income tax                                                                    
  expense                                                                       
  Income tax                       46.2                     12.5                
  expense                                                                       
  Equity in                                                                     
  net loss of                       0.2                      0.8                
  affiliates                                                                    
  Net income                                   $343.4                   $186.2  
  Basic                                                                         
  earnings per                                  $2.25                    $1.23  
  common                                                                        
  share:                                                                        
  Diluted                                                                       
  earnings per                                  $2.24                    $1.22  
  common                                                                        
  share:                                                                        
  Weighted                                                                      
  average                                                                       
  shares                                                                        
  outstanding:                                                                  
  Basic                           152.7                    151.6                
  Diluted                         153.6                    152.1                
                                                                                
                         Entegris, Inc. - page 5 of 13                          
                                                                                
                        Entegris, Inc. and Subsidiaries                         
                                                                                
                                                                                
                     Condensed Consolidated Balance Sheets                      
                                                                                
                                 (In millions)                                  
                                                                                
                                  (Unaudited)                                   
                                                                            
                                              Sep 26, 2026    Dec 31, 2025  
 ────────────────────────────────────────────────────────────────────────── 
  ASSETS                                                                    
  Current assets:                                                           
  Cash and cash equivalents                         $356.5          $360.4  
  Trade accounts and notes receivable, net           625.2           458.7  
  Inventories, net                                   769.0           643.2  
  Deferred tax charges and refundable                 35.1            35.1  
  income taxes                                                              
  Other current assets                               134.9           140.8  
  Total current assets                             1,920.7         1,638.2  
  Property, plant and equipment, net               1,621.8         1,636.1  
  Right-of-use assets                                111.5           108.7  
  Goodwill                                         3,950.0         3,946.7  
  Intangible assets, net                             769.1           906.9  
  Deferred tax assets and other noncurrent           126.8            91.6  
  tax assets                                                                
  Other noncurrent assets                             40.7            22.3  
  Total assets                                    $8,540.6        $8,350.5  
  LIABILITIES AND EQUITY                                                    
  Current liabilities                                                       
  Accounts payable                                  $262.4          $171.5  
  Accrued liabilities                                404.2           234.7  
  Income taxes payable                                55.5            82.4  
  Total current liabilities                          722.1           488.6  
  Long-term debt                                   3,260.6         3,697.6  
  Long-term lease liabilities                        100.4            98.6  
  Other liabilities                                  124.6           112.3  
  Shareholders’ equity                             4,332.9         3,953.4  
  Total liabilities and equity                    $8,540.6        $8,350.5  
                                                                            
                         Entegris, Inc. - page 6 of 13                          
                                                                                
                        Entegris, Inc. and Subsidiaries                         
                                                                                
                                                                                
                Condensed Consolidated Statements of Cash Flows                 
                                                                                
                                 (In millions)                                  
                                                                                
                                  (unaudited)                                   
                                                                                
             Three                             Nine                             
             months       Sep 26,     Sep 27,  months       Sep 26,    Sep 27,  
             ended           2026        2025  ended           2026       2025  
 ────────────────────────────────────────────────────────────────────────────── 
  Operat…                                                                       
  activi…                                                                       
  Net                      $157.8       $70.5                $343.4     $186.2  
  income                                                                        
  Adjust…                                                                       
  to                                                                            
  reconc…                                                                       
  net                                                                           
  income                                                                        
  to                                                                            
  net                                                                           
  cash                                                                          
  provid…                                                                       
  by                                                                            
  operat…                                                                       
  activi…                                                                       
  Deprec…                    33.9        50.4                 102.4      151.6  
  Amorti…                    45.6        46.0                 138.0      138.1  
  Share-…                                                                       
  compen…                    19.7        18.4                  54.8       50.4  
  expense                                                                       
  Provis…                                                                       
  for                                                                           
  deferr…                     0.4       -19.4                 -23.2      -54.8  
  income                                                                        
  taxes                                                                         
  Other                      14.4        14.8                  56.4       56.8  
  Changes                                                                       
  in                                                                            
  operat…                                                                       
  assets                                                                        
  and                                                                           
  liabil…                                                                       
  Trade                                                                         
  accoun…                                                                       
  and                       -66.3        -1.3                -167.5        7.5  
  notes                                                                         
  receiv…                                                                       
  Invent…                   -69.9        41.7                -153.2      -34.4  
  Accoun…                                                                       
  payable                                                                       
  and                       152.2        60.2                 266.7       34.5  
  accrued                                                                       
  liabil…                                                                       
  Income                                                                        
  taxes                                                                         
  payable                                                                       
  and                       -15.7       -28.9                 -24.0      -41.5  
  refund…                                                                       
  income                                                                        
  taxes                                                                         
  Other                      -5.3        -2.9                  12.2        9.0  
  Net                                                                           
  cash                                                                          
  provid…                   266.8       249.5                 606.0      503.4  
  by                                                                            
  operat…                                                                       
  activi…                                                                       
  Invest…                                                                       
  activi…                                                                       
  Acquis…                                                                       
  of                                                                            
  proper…                   -43.2       -66.7                -124.0     -241.2  
  plant                                                                         
  and                                                                           
  equipm…                                                                       
  Procee…                                                                       
  from                          —         8.2                   5.4        8.2  
  govern…                                                                       
  incent…                                                                       
  Other                      -6.1        -1.2                  -5.3       -1.5  
  Net                                                                           
  cash                                                                          
  used in                   -49.3       -59.7                -123.9     -234.5  
  invest…                                                                       
  activi…                                                                       
  Financ…                                                                       
  activi…                                                                       
  Procee…                                                                       
  from                          —        25.0                  65.0      532.0  
  debt                                                                          
  Paymen…                  -200.0      -175.0                -515.0     -682.0  
  of debt                                                                       
  Paymen…                                                                       
  for                                                                           
  debt                          —           —                  -2.0          —  
  issuan…                                                                       
  costs                                                                         
  Paymen…                                                                       
  for                       -15.4       -15.1                 -46.2      -45.7  
  divide…                                                                       
  Issuan…                                                                       
  of                          1.1         2.1                  33.6        3.6  
  common                                                                        
  stock                                                                         
  Taxes                                                                         
  paid                                                                          
  related                                                                       
  to net                                                                        
  share                      -2.0        -0.5                 -20.8      -10.6  
  settle…                                                                       
  of                                                                            
  equity                                                                        
  awards                                                                        
  Other                      -0.4        -0.4                  -1.4       -1.4  
  Net                                                                           
  cash                                                                          
  used in                  -216.7      -163.9                -486.8     -204.1  
  financ…                                                                       
  activi…                                                                       
  Effect                                                                        
  of                                                                            
  exchan…                                                                       
  rate                                                                          
  changes                     2.1        -2.9                   0.8        5.8  
  on cash                                                                       
  and                                                                           
  cash                                                                          
  equiva…                                                                       
  Increa…                                                                       
  (decre…                                                                       
  in cash                     2.9        23.0                  -3.9       70.6  
  and                                                                           
  cash                                                                          
  equiva…                                                                       
  Cash                                                                          
  and                                                                           
  cash                                                                          
  equiva…                   353.6       376.8                 360.4      329.2  
  at                                                                            
  beginn…                                                                       
  of                                                                            
  period                                                                        
  Cash                                                                          
  and                                                                           
  cash                                                                          
  equiva…                  $356.5      $399.8                $356.5     $399.8  
  at end                                                                        
  of                                                                            
  period                                                                        
                                                                                
                         Entegris, Inc. - page 7 of 13                          
                                                                                
                        Entegris, Inc. and Subsidiaries                         
                                                                                
                                                                                
                              Segment Information                               
                                                                                
                                 (In millions)                                  
                                                                                
                                  (Unaudited)                                   
                                                                                
          Three      Sep      Sep      Jun  Nine            Sep            Sep  
  Net     mont…      26,      27,      27,  mont…           26,            27,  
  sal…    ended     2026     2025     2026  ended          2026           2025  
 ────────────────────────────────────────────────────────────────────────────── 
  Mat…             $404…    $348…    $371…                $1,1…           $1,…  
  Sol…                                                                          
  Adv…                                                                          
  Pur…             604.9    460.8    514.6         1,58…           1,33…        
  Sol…                                                                          
  Int…              -3.3     -2.3     -2.7                 -8.8           -6.8  
  eli…                                                                          
  Tot…                                                                          
  net              $1,0…    $807…    $883…                $2,7…           $2,…  
  sal…                                                                          
                                                                                
                                                                                
           Three        Sep                  Jun  Nine          Sep             
  Segm…    months       26,    Sep 27,       27,  months        26,    Sep 27,  
  prof…    ended       2026       2025      2026  ended        2026       2025  
 ────────────────────────────────────────────────────────────────────────────── 
  Mate…               $84.3      $65.2     $77.7             $237.9     $212.7  
  Solu…                                                                         
  Adva…                                                                         
  Puri…               212.7      118.2     150.9              497.2      322.2  
  Solu…                                                                         
  Total                                                                         
  segm…               297.0      183.4     228.6              735.1      534.9  
  prof…                                                                         
  Amor…                                                                         
  of                  -45.6      -46.0     -46.1             -138.0     -138.1  
  inta…                                                                         
  Unal…               -20.8      -14.8     -17.9              -60.3      -45.8  
  expe…                                                                         
  Total                                                                         
  oper…              $230.6     $122.6    $164.6             $536.8     $351.0  
  inco…                                                                         
                                                                                
                         Entegris, Inc. - page 8 of 13                          
                                                                                
                        Entegris, Inc. and Subsidiaries                         
                                                                                
          Reconciliation of GAAP Gross Profit to Adjusted Gross Profit          
                                                                                
                                 (In millions)                                  
                                                                                
                                  (Unaudited)                                   
                                                                                
        Thr…        Sep          Sep          Jun  Ni…        Sep          Sep  
        mon…        26,          27,          27,  mo…        26,          27,  
        end…       2026         2025         2026  en…        20…          20…  
 ────────────────────────────────────────────────────────────────────────────── 
  N…               $1,…         $80…         $88…             $2…          $2…  
  s…                                                                            
  G…               $50…         $35…         $42…             $1…          $1…  
  p…                                                                            
  A…                                                                            
  to                                                                            
  g…                                                                            
  p…                                                                            
  I…                                                                            
  T…               -8.3            —            —             -8…            —  
  r…                                                                            
  R…                0.2          0.3          0.2             0.7          2.6  
  c…                                                                            
  A…                                                                            
  g…               $49…         $35…         $42…             $1…          $1…  
  p…                                                                            
  G…                                                                            
  m…                                                                            
  -                                                                             
  as                                                                            
  a           49…     %    43…     %    47…     %       48.2    %    44.6    %  
  %                                                                             
  of                                                                            
  n…                                                                            
  s…                                                                            
  A…                                                                            
  g…                                                                            
  m…                                                                            
  -                                                                             
  as          48…     %    43…     %    47…     %       47.9    %    44.8    %  
  a                                                                             
  %                                                                             
  of                                                                            
  n…                                                                            
  s…                                                                            
                                                                                
(1) In the three months ended September 26, 2026, the Company received $8.3
million of refunds of International Emergency Economic Powers Act (IEEPA)
tariffs that were recognized in cost of goods sold as incurred from April 2025
through February 2026 and were not excluded from the Company's non-GAAP results
in those periods. The Company excluded the IEEPA tariff refunds from non-GAAP
results because they represent a discrete, non-recurring, out-of-period recovery
arising from a legal and regulatory development rather than ongoing operating
performance.

(2) Restructuring charges resulting from discrete cost saving initiatives
inclusive of employee termination benefit and asset impairment charges,
primarily related to (i) an internal reorganization, combining two complementary
divisions into one and realigning our customer-facing organization, (ii)
workforce reductions and (iii) the planned wind-down of the Company’s Life
Sciences Fluid Management business.
                         Entegris, Inc. - page 9 of 13                          
                                                                                
                        Entegris, Inc. and Subsidiaries                         
                                                                                
       Reconciliation of GAAP Segment Profit to Adjusted Operating Income       
                                                                                
                                 (In millions)                                  
                                                                                
                                  (Unaudited)                                   
                                                                                
  Ad…    Thr…        Sep         Sep          Jun  Ni…        Sep          Sep  
  se…    mon…        26,         27,          27,  mo…        26,          27,  
  pr…    end…       2026         20…         2026  en…        20…          20…  
 ────────────────────────────────────────────────────────────────────────────── 
  MS                                                                            
  se…               $84…         $6…         $77…             $2…          $2…  
  pr…                                                                           
  IE…                                                                           
  ta…          -2…                 —            —             -2…            —  
  re…                                                                           
  Re…          0.1               0.7            —             1.3          3.8  
  co…                                                                           
  MS                                                                            
  ad…               $82…         $6…         $77…             $2…          $2…  
  se…                                                                           
  pr…                                                                           
  APS                                                                           
  se…               $21…         $1…         $15…             $4…          $3…  
  pr…                                                                           
  IE…                                                                           
  ta…          -6…            —           —             -6.2            —       
  re…                                                                           
  Re…          1.7          1.0         4.9              8.1         13.2       
  co…                                                                           
  APS                                                                           
  ad…               $20…         $1…         $15…             $4…          $3…  
  se…                                                                           
  pr…                                                                           
  Un…                                                                           
  ge…                                                                           
  and               $20…         $1…         $17…             $6…          $4…  
  ad…                                                                           
  ex…                                                                           
  Le…                                                                           
  un…                0.3           —         -0.7             -1…          -0…  
  re…                                                                           
  co…                                                                           
  Ad…                                                                           
  un…                                                                           
  ge…               $21…         $1…         $17…             $5…          $4…  
  and                                                                           
  ad…                                                                           
  ex…                                                                           
  To…                                                                           
  ad…               $29…         $1…         $23…             $7…          $5…  
  se…                                                                           
  pr…                                                                           
  Le…                                                                           
  ad…                                                                           
  un…                                                                           
  ge…               -21…         -1…         -17…             -5…          -4…  
  and                                                                           
  ad…                                                                           
  ex…                                                                           
  To…                                                                           
  ad…               $26…         $1…         $21…             $6…          $5…  
  op…                                                                           
  in…                                                                           
                                                                                
(1) In the three months ended September 26, 2026, the Company received $8.3
million of refunds of International Emergency Economic Powers Act (IEEPA)
tariffs that were recognized in cost of goods sold as incurred from April 2025
through February 2026 and were not excluded from the Company's non-GAAP results
in those periods. The Company excluded the IEEPA tariff refunds from non-GAAP
results because they represent a discrete, non-recurring, out-of-period recovery
arising from a legal and regulatory development rather than ongoing operating
performance.

(2) Restructuring charges resulting from discrete cost saving initiatives
inclusive of employee termination benefit and asset impairment charges,
primarily related to (i) an internal reorganization, combining two complementary
divisions into one and realigning our customer-facing organization, (ii)
workforce reductions and (iii) the planned wind-down of the Company’s Life
Sciences Fluid Management business.
                         Entegris, Inc. - page 10 of 13                         
                                                                                
                        Entegris, Inc. and Subsidiaries                         
                                                                                
  Reconciliation of GAAP Net Income to Adjusted Operating Income and Adjusted   
                                     EBITDA                                     
                                                                                
                                 (In millions)                                  
                                                                                
                                  (Unaudited)                                   
                                                                                
        Thr…        Sep          Sep          Jun  Ni…        Sep          Sep  
        mon…        26,          27,          27,  mo…        26,          27,  
        end…       2026         2025         2026  en…        20…          20…  
 ────────────────────────────────────────────────────────────────────────────── 
  N…               $1,…         $80…         $88…             $2…          $2…  
  s…                                                                            
  N…               $15…         $70…         $93…             $3…          $1…  
  i…                                                                            
  N…                                                                            
  i…                                                                            
  -                                                                             
  as                                                                            
  a           15…     %    8.7     %    10…     %       12.7    %     7.8    %  
  %                                                                             
  of                                                                            
  n…                                                                            
  s…                                                                            
  A…                                                                            
  to                                                                            
  n…                                                                            
  i…                                                                            
  E…                                                                            
  in                                                                            
  n…                  —          0.3            —             0.2          0.8  
  l…                                                                            
  of                                                                            
  a…                                                                            
  I…                                                                            
  t…               28.7          1.5         16.5             46…          12…  
  e…                                                                            
  I…                                                                            
  e…               43.9         46.1         46.7             13…          14…  
  n…                                                                            
  O…                                                                            
  e…                0.2          4.2          7.8             9.4          5.3  
  n…                                                                            
  G…                                                                            
  -                230…         122…         164…             53…          35…  
  O…                                                                            
  i…                                                                            
  O…                                                                            
  m…                                                                            
  -                                                                             
  as                                                                            
  a           22…     %    15…     %    18…     %       19.9    %    14.8    %  
  %                                                                             
  of                                                                            
  n…                                                                            
  s…                                                                            
  I…                                                                            
  t…               -8.3            —            —             -8…            —  
  r…                                                                            
  R…                1.5          1.7          5.6             11…          17…  
  c…                                                                            
  A…                                                                            
  of               45.6         46.0         46.1             13…          13…  
  i…                                                                            
  a…                                                                            
  A…                                                                            
  o…               269…         170…         216…             67…          50…  
  i…                                                                            
  A…                                                                            
  o…                                                                            
  m…                                                                            
  -                                                                             
  as          26…     %    21…     %    24…     %       25.1    %    21.3    %  
  a                                                                             
  %                                                                             
  of                                                                            
  n…                                                                            
  s…                                                                            
  D…               33.9         50.4         34.4             10…          15…  
  A…               $30…         $22…         $25…             $7…          $6…  
  E…                                                                            
  A…                                                                            
  E…                                                                            
  -                                                                             
  as                                                                            
  a           30…     %    27…     %    28…     %       28.9    %    27.7    %  
  %                                                                             
  of                                                                            
  n…                                                                            
  s…                                                                            
                                                                                
(1) In the three months ended September 26, 2026, the Company received $8.3
million of refunds of International Emergency Economic Powers Act (IEEPA)
tariffs that were recognized in cost of goods sold as incurred from April 2025
through February 2026 and were not excluded from the Company's non-GAAP results
in those periods. The Company excluded the IEEPA tariff refunds from non-GAAP
results because they represent a discrete, non-recurring, out-of-period recovery
arising from a legal and regulatory development rather than ongoing operating
performance.

(2) Restructuring charges resulting from discrete cost saving initiatives
inclusive of employee termination benefit and asset impairment charges,
primarily related to (i) an internal reorganization, combining two complementary
divisions into one and realigning our customer-facing organization, (ii)
workforce reductions and (iii) the planned wind-down of the Company’s Life
Sciences Fluid Management business.

(3) Non-cash amortization expense associated with intangibles acquired in
acquisitions.
                         Entegris, Inc. - page 11 of 13                         
                                                                                
                        Entegris, Inc. and Subsidiaries                         
                                                                                
Reconciliation of GAAP Net Income and Diluted Earnings per Common Share to Non- 
         GAAP Net Income and Diluted Non-GAAP Earnings per Common Share         
                                                                                
                      (In millions, except per share data)                      
                                                                                
                                  (Unaudited)                                   
                                                                                
           Three        Sep                  Jun  Nine          Sep             
           months       26,    Sep 27,       27,  months        26,    Sep 27,  
           ended       2026       2025      2026  ended        2026       2025  
 ────────────────────────────────────────────────────────────────────────────── 
  GAAP                                                                          
  net                $157.8      $70.5     $93.6             $343.4     $186.2  
  inco…                                                                         
  Adju…                                                                         
  to                                                                            
  net                                                                           
  inco…                                                                         
  IEEPA                                                                         
  tari…                -8.3          —         —               -8.3          —  
  refu…                                                                         
  Rest…                 1.5        1.7       5.6               11.2       17.4  
  cost…                                                                         
  Equi…                                                                         
  inve…                   —          —       6.7                6.7          —  
  impa…                                                                         
  Loss                                                                          
  on                                                                            
  exti…                 1.7        1.7       1.7                3.9        1.7  
  of                                                                            
  debt…                                                                         
  Amor…                                                                         
  of                   45.6       46.0      46.1              138.0      138.1  
  inta…                                                                         
  asse…                                                                         
  Tax                                                                           
  effe…                                                                         
  of                                                                            
  adju…                                                                         
  to                                                                            
  net                  -8.6      -10.0     -11.0              -30.0      -31.4  
  inco…                                                                         
  and                                                                           
  disc…                                                                         
  tax                                                                           
  item…                                                                         
  Non-…                                                                         
  net                $189.7     $109.9    $142.7             $464.9     $312.0  
  inco…                                                                         
  Dilu…                                                                         
  earn…                                                                         
  per                 $1.03      $0.46     $0.61              $2.24      $1.22  
  comm…                                                                         
  share                                                                         
  Effe…                                                                         
  of                                                                            
  adju…               $0.21      $0.26     $0.32              $0.79      $0.83  
  to                                                                            
  net                                                                           
  inco…                                                                         
  Dilu…                                                                         
  non-…                                                                         
  earn…               $1.23      $0.72     $0.93              $3.03      $2.05  
  per                                                                           
  comm…                                                                         
  shar…                                                                         
  Dilu…                                                                         
  weig…                                                                         
  aver…               153.9      152.3     153.6              153.6      152.1  
  shar…                                                                         
  outs…                                                                         
                                                                                
(1) In the three months ended September 26, 2026, the Company received $8.3
million of refunds of International Emergency Economic Powers Act (IEEPA)
tariffs that were recognized in cost of goods sold as incurred from April 2025
through February 2026 and were not excluded from the Company's non-GAAP results
in those periods. The Company excluded the IEEPA tariff refunds from non-GAAP
results because they represent a discrete, non-recurring, out-of-period recovery
arising from a legal and regulatory development rather than ongoing operating
performance.

(2) Restructuring charges resulting from discrete cost saving initiatives
inclusive of employee termination benefit and asset impairment charges,
primarily related to (i) an internal reorganization, combining two complementary
divisions into one and realigning our customer-facing organization, (ii)
workforce reductions and (iii) the planned wind-down of the Company’s Life
Sciences Fluid Management business.

(3) Equity investment impairment loss in 2026 that reduced our carrying basis to
zero.

(4) Loss on extinguishment of debt of our Term Loan Facility in 2026.

(5) Non-cash amortization expense associated with intangibles acquired in
acquisitions.

(6) The tax effect of pre-tax adjustments to net income was calculated using the
applicable marginal tax rate for each respective year.

(7) As a result of displaying amounts in millions, the per-share components may
not sum due to rounding.
                         Entegris, Inc. - page 12 of 13                         
                                                                                
                        Entegris, Inc. and Subsidiaries                         
                                                                                
              Reconciliation of GAAP Outlook to Non-GAAP Outlook *              
                                                                                
                      (In millions, except per share data)                      
                                                                                
                                  (Unaudited)                                   
                                                                                
  Reconciliation GAAP Operating Margin                                          
  to                                                                            
  non-GAAP Operating Margin and                                                 
  Adjusted                                 Fourth Quarter      December 31,     
  EBITDA Margin                            Outlook             2026             
 ────────────────────────────────────────────────────────────────────────────── 
  Net sales                                                    $1,025 - $1,055  
  GAAP - Operating income                                      $235 - $250      
  Operating margin - as a % of net                             23.0% - 23.7%    
  sales                                                                         
  Amortization of intangible assets                        45                   
  Adjusted operating income                                    $281 - $295      
  Adjusted operating margin - as a % of                        27.4% - 27.9%    
  net sales                                                                     
  Depreciation                                             34                   
  Adjusted EBITDA                                              $315- $329       
  Adjusted EBITDA - as a % of net sales                        30.7% - 31.2%    
                                                                                
                                                                                
  Reconciliation GAAP net income to non-GAAP                                    
  net                                                   Fourth Quarter Outlook  
  income                                                December 31, 2026       
 ────────────────────────────────────────────────────────────────────────────── 
  GAAP net income                                       $168 - $181             
  Adjustments to net income:                                                    
  Amortization of intangible assets                 45                          
  Income tax effect                                -11                          
  Non-GAAP net income                                   $203- $215              
                                                                                
                                                                                
  Reconciliation GAAP diluted earnings per                                      
  share                                                 Fourth Quarter Outlook  
  to non-GAAP diluted earnings per share                December 31, 2026       
 ────────────────────────────────────────────────────────────────────────────── 
  Diluted earnings per common share                     $1.09 - $1.17           
  Adjustments to earnings per share:                                            
  Amortization of intangible assets               0.29                          
  Income tax effect                              -0.06                          
  Diluted non-GAAP earnings per common share            $1.32 - $1.40           
  *As a result of displaying amounts in                                         
  millions,                                                                     
  rounding differences may exist in the                                         
  tables.                                                                       
                                                                                
                                                                                
                                  ### END ###                                   
                                                                                
                         Entegris, Inc. - page 13 of 13                         

Sources

The 8-K item 2.02 filings (SEC EDGAR) and their EX-99 exhibits: the results release and, when filed, prepared remarks or the call transcript.

Also

Said vs did: the targets in these releases against what was then reported. Filings: every filing.

Work with it

Excel workbook · CSV. Google Sheet that stays up to date: paste =IMPORTDATA("https://tickdelta.com/company/ENTG/export.csv") into a cell.

Next:Presentations
Esc

Type a ticker such as AAPL, a name, an investor such as Buffett, or a topic such as tariffs. ↑ ↓ to move, Enter to open.