ESSEssex Property Trust
Essex Property Trust, Inc. (“Essex”), a Maryland corporation, is an S&P 500 company that operates as a self-administered and self-managed real estate investment trust (“REIT”). 10-K, Item 1
- Employees
- 1,689
- Headquarters
- San Mateo, CA
- CEO
- Angela L. Kleiman
- Next results
- around Feb 3, 2027
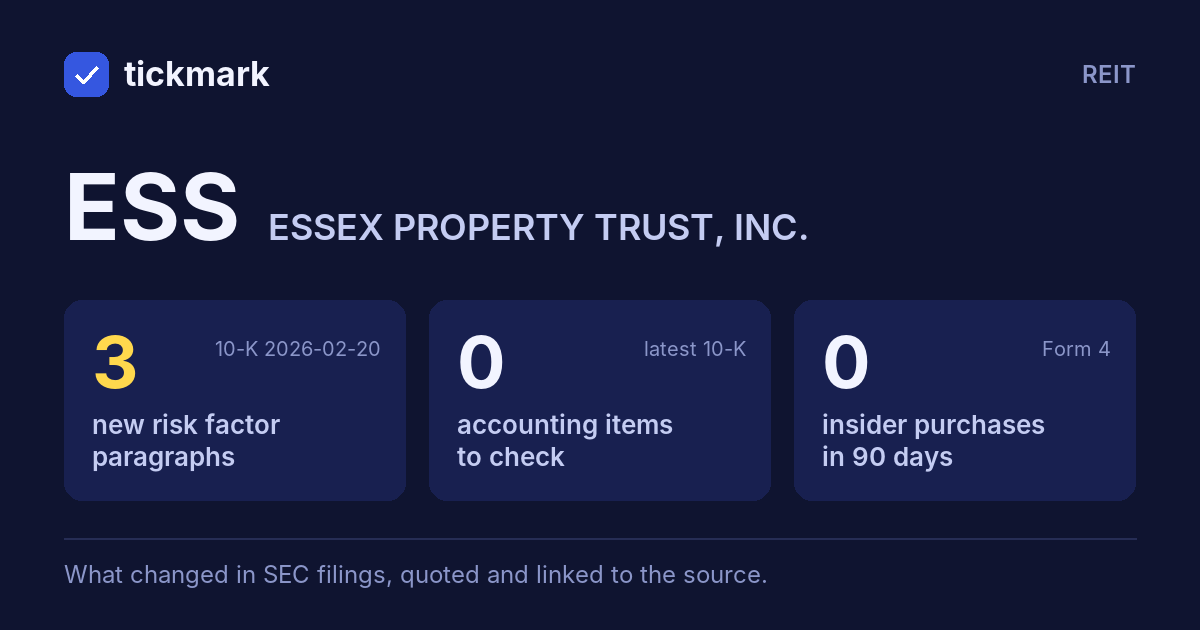
The biggest changes in the 10-K filed 2026-02-20, this fiscal year against the last, and the sentences in the MD&A (Item 7) where management explains them, quoted word for word. Tickdelta picks sentences that name the line, a direction and a cause. It does not write explanations of its own.
Operating margin
6849.4% → 9586.6% (+2737.1 pts) Big change FY to 2025-12-31 vs 2024-12-31The MD&A has no sentence that names a cause for this change. That can be worth a question: ask about the filing.
Gross margin
12105.7% → 14060.1% (+1954.4 pts) Big change FY to 2025-12-31 vs 2024-12-31The MD&A has no sentence that names a cause for this change. That can be worth a question: ask about the filing.
Net income
-9.7% FY to 2025-12-31 vs 2024-12-31“Interest and other income decreased by $61.0 million or 75.3% to $20.0 million in 2025 compared to $81.0 million in 2024, primarily due to a decrease of $42.9 million in gains from legal settlements.”
Read it in the 10-K ↗
Revenue
-8.6% FY to 2025-12-31 vs 2024-12-31“By excluding gains or losses related to sales of depreciated operating properties and land, excluding real estate depreciation (which can vary among owners of identical assets in similar condition based on historical cost accounting and useful life estimates) and excluding impairment write-downs from operating real estate and unconsolidated co-investments driven by a measurable decrease in the fair value of real estate held by the co-investment, FFO can help investors compare the operating performance of a real estate company between periods or as compared to different companies.”
Read it in the 10-K ↗
Cash from operations
+0.6% FY to 2025-12-31 vs 2024-12-31The MD&A has no sentence that names a cause for this change. That can be worth a question: ask about the filing.
Changes are computed from the XBRL figures in the same 10-K. Hover a number to see the line item. Open the 10-K ↗
Work on ESS in a spreadsheet:
Excel workbook (a sheet per section, ten years by column, charts, links to the filings) ·
CSV.
For a Google Sheet that stays up to date, paste =IMPORTDATA("https://tickdelta.com/company/ESS/export.csv") into a cell.