MOSMosaic
The Mosaic Company is the world’s leading producer and marketer of concentrated phosphate and potash crop nutrients. 10-K, Item 1
- Employees
- 13,249
- Headquarters
- Tampa, FL
- CEO
- Bruce M. Bodine
- Next results
- around Feb 23, 2027
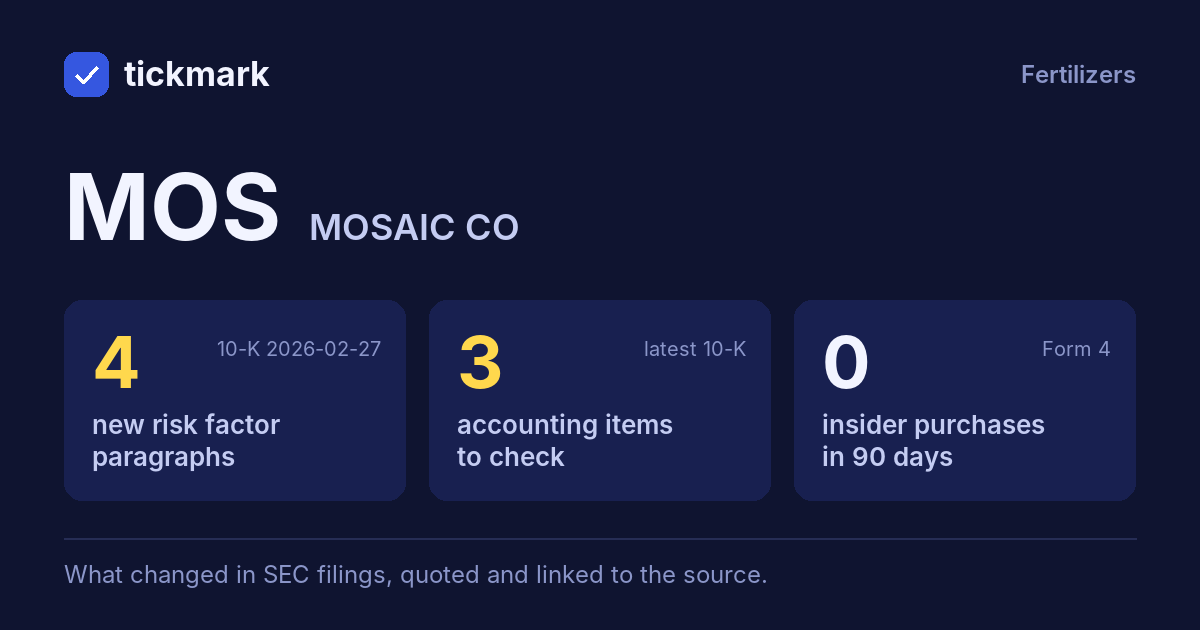
The biggest changes in the 10-K filed 2026-02-27, this fiscal year against the last, and the sentences in the MD&A (Item 7) where management explains them, quoted word for word. Tickdelta picks sentences that name the line, a direction and a cause. It does not write explanations of its own.
Net income
+209.1% Big change FY to 2025-12-31 vs 2024-12-31The MD&A has no sentence that names a cause for this change. That can be worth a question: ask about the filing.
Cash from operations
-36.5% Big change FY to 2025-12-31 vs 2024-12-31The MD&A has no sentence that names a cause for this change. That can be worth a question: ask about the filing.
Gross margin
13.6% → 15.8% (+2.2 pts) Big change FY to 2025-12-31 vs 2024-12-31“Gross margin for the current year increased $390.0 million from the prior year driven by higher finished good sales pricing across our segments, as discussed further below.”
Read it in the 10-K ↗
“China and India gross margin was favorably impacted by higher selling prices, partially offset by the impact of higher product costs in the current year period compared to the prior year.”
Read it in the 10-K ↗
Operating margin
5.6% → 6.8% (+1.2 pts) Big change FY to 2025-12-31 vs 2024-12-31The MD&A has no sentence that names a cause for this change. That can be worth a question: ask about the filing.
Revenue
+8.4% FY to 2025-12-31 vs 2024-12-31“The increase in net sales was driven by higher average finished product selling prices, which favorably impacted net sales by approximately $450 million.”
Read it in the 10-K ↗
“The Phosphate segment’s sales volumes of finished products decreased to 5.9 million tonnes for the year ended December 31, 2025, compared to 6.4 million tonnes in 2024, due to the factors discussed in the Overview.”
Read it in the 10-K ↗
Changes are computed from the XBRL figures in the same 10-K. Hover a number to see the line item. Open the 10-K ↗
Work on MOS in a spreadsheet:
Excel workbook (a sheet per section, ten years by column, charts, links to the filings) ·
CSV.
For a Google Sheet that stays up to date, paste =IMPORTDATA("https://tickdelta.com/company/MOS/export.csv") into a cell.