Nextpower Inc. NXT
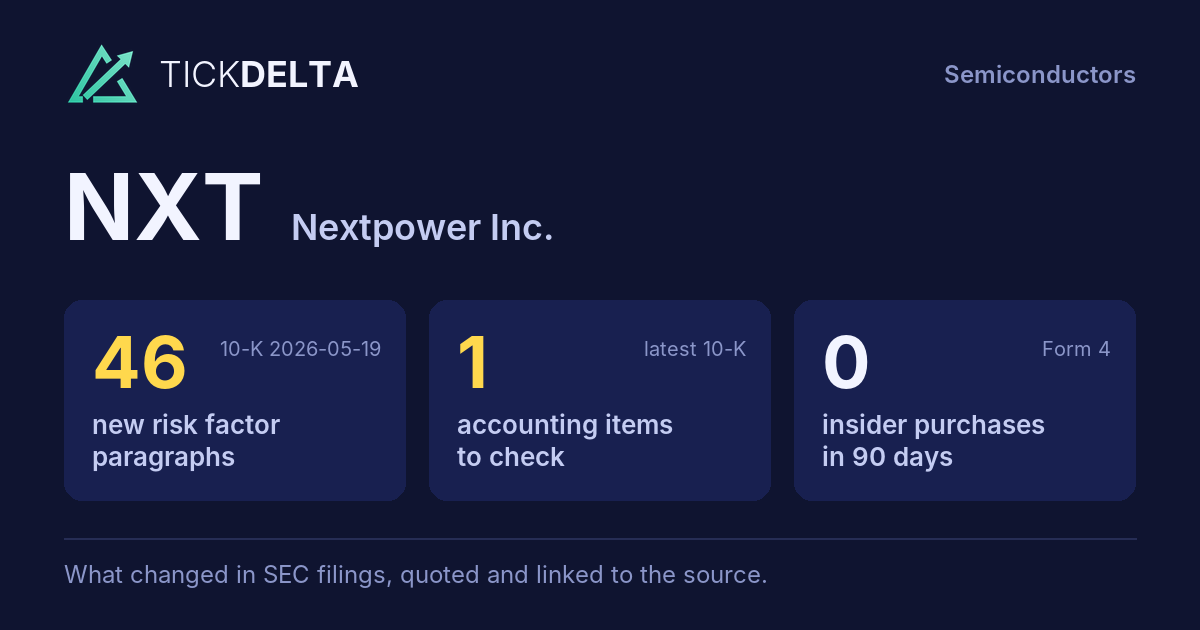
The biggest changes in the 10-K filed May 19, 2026, in management's words
10-K, Item 7This fiscal year against the last, and the sentences in the MD&A where management explains each change. Tickdelta picks sentences that name the line, a direction and a cause. It does not write explanations of its own.
Revenue
Big change, FY to Mar 31, 2026 vs Mar 31, 2025
“Revenue increased by $600.2 million, or 20%, for our fiscal year 2026 compared to fiscal year 2025, driven by a 13% increase in GW delivered as we delivered approximately 38 GW during fiscal year 2026, compared to 34 GW during fiscal year 2025.”
Read it in the 10-K
“The revenue increase was driven primarily by higher customer demand in the U.S., along with a $365.0 million rise in point in time revenue reflecting year over year increase in components directly shipped to our customers’ designated locations including software licenses, coupled with additional contributions from our recent business acquisitions.”
Read it in the 10-K
Operating margin
Big change, FY to Mar 31, 2026 vs Mar 31, 2025
“Research and development expenses increased $41.5 million, or 52%, to $120.9 million for fiscal year 2026 from approximately $79.4 million during fiscal year 2025 driven by our continued investment in innovation, increasing our engineering team and supporting our new expanded product portfolio.”
Read it in the 10-K
Net income
Big change, FY to Mar 31, 2026 vs Mar 31, 2025
“The decrease in tax expense as well as effective tax rate from fiscal year 2025 to 2026 is driven by an increase in realizable foreign tax credits related to prior year transfer pricing adjustments and deferred tax benefit due to an increase to the estimated U.S. state tax rate.”
Read it in the 10-K
“Cash from net income was further decreased by the overall increase in our net working capital accounts driven by the growth in our operations resulting in an outflow of approximately $211.8 million during the fiscal year.”
Read it in the 10-K
Gross margin
Big change, FY to Mar 31, 2026 vs Mar 31, 2025
“Gross profit increased by $151.3 million, or 15%, during fiscal year 2026 compared to fiscal year 2025, primarily resulting from the U.S. revenue growth noted above and the impact of the 45X Credit recognized, offset by the higher tariffs coupled with the higher cost associated with our increase in headcount noted above.”
Read it in the 10-K
“Gross margin decreased by 150 basis points, to 32.6% for fiscal year 2026 from 34.1% for fiscal year 2025 primarily resulting from the increase in tariffs noted above that were not fully included in pricing.”
Read it in the 10-K
Cash from operations
Big change, FY to Mar 31, 2026 vs Mar 31, 2025
The MD&A has no sentence that names a cause for this change.
What management said, year by year
The cause given in each 10-K, 2 fiscal years, newest first · MD&A (Item 7)
Each bar is how the line changed that year (from the same 10-K's XBRL). Under it, the sentence in that year's MD&A that names the line, a direction and a cause, word for word. A year with no sentence says so.
Revenue
2 of 2 years explained-
FY 2026 +20.3%
“Revenue increased by $600.2 million, or 20%, for our fiscal year 2026 compared to fiscal year 2025, driven by a 13% increase in GW delivered as we delivered approximately 38 GW during fiscal year 2026, compared to 34 GW during fiscal year 2025.”
Read it in the FY 2026 10-K“The revenue increase was driven primarily by higher customer demand in the U.S., along with a $365.0 million rise in point in time revenue reflecting year over year increase in components directly shipped to our customers’ designated locations including software licenses, coupled with additional contributions from our recent business acquisitions.”
Read it in the FY 2026 10-K -
FY 2025 +18.4%
“Revenue increased by $459.4 million, or 18%, for our fiscal year 2025 compared to fiscal year 2024, driven by a 29% increase in GW delivered as we delivered approximately 34 GW during fiscal year 2025, compared to 26 GW during fiscal year 2024.”
Read it in the FY 2025 10-K“Offsetting the cash outflows were increases in deferred revenue of approximately $120.5 million, primarily resulting from increased operations, upfront funding of new contracts, and increases in other liabilities of approximately $21.8 million.”
Read it in the FY 2025 10-K
Gross margin
2 of 2 years explained-
FY 2026 -1.5 pts
“Gross profit increased by $151.3 million, or 15%, during fiscal year 2026 compared to fiscal year 2025, primarily resulting from the U.S. revenue growth noted above and the impact of the 45X Credit recognized, offset by the higher tariffs coupled with the higher cost associated with our increase in headcount noted above.”
Read it in the FY 2026 10-K“Gross margin decreased by 150 basis points, to 32.6% for fiscal year 2026 from 34.1% for fiscal year 2025 primarily resulting from the increase in tariffs noted above that were not fully included in pricing.”
Read it in the FY 2026 10-K -
FY 2025 +1.6 pts
“Cost of sales increased by $263.6 million, or 16%, during fiscal year 2025 compared to fiscal year 2024 primarily due to the increase in GW delivered noted above, offset by the impact from the 45X Credit.”
Read it in the FY 2025 10-K“Gross profit increased by $195.8 million, or 24%, during fiscal year 2025 compared to fiscal year 2024, primarily resulting from the U.S. and Rest of the World revenue growth noted above and the impact of the 45X Credit discussed below.”
Read it in the FY 2025 10-K
Operating margin
2 of 2 years explained-
FY 2026 -2.0 pts
“Research and development expenses increased $41.5 million, or 52%, to $120.9 million for fiscal year 2026 from approximately $79.4 million during fiscal year 2025 driven by our continued investment in innovation, increasing our engineering team and supporting our new expanded product portfolio.”
Read it in the FY 2026 10-K -
FY 2025 -1.9 pts
“Research and development expenses increased $37.0 million, or 87%, to $79.4 million for fiscal year 2025 from approximately $42.4 million during fiscal year 2024 driven by our continued investment in innovation, expanding our engineering team and supporting our new business acquisitions.”
Read it in the FY 2025 10-K
Net income
2 of 2 years explained-
FY 2026 +15.1%
“The decrease in tax expense as well as effective tax rate from fiscal year 2025 to 2026 is driven by an increase in realizable foreign tax credits related to prior year transfer pricing adjustments and deferred tax benefit due to an increase to the estimated U.S. state tax rate.”
Read it in the FY 2026 10-K“Cash from net income was further decreased by the overall increase in our net working capital accounts driven by the growth in our operations resulting in an outflow of approximately $211.8 million during the fiscal year.”
Read it in the FY 2026 10-K -
FY 2025 +66.3%
“The increase in tax expense as well as effective tax rate from fiscal year 2024 to 2025 is driven by a reduction in tax benefits related to stock based compensation associated with the non-deductible executive compensation, and the change in the amount of non-controlling interests as further described in Note 6 in the notes to the consolidated financial statements included elsewhere in this Annual report on Form 10-K.”
Read it in the FY 2025 10-K“Cash from net income was further decreased by the overall increase in our net operating assets and liabilities, primarily our net working capital accounts, resulting in an outflow of approximately $92.8 million.”
Read it in the FY 2025 10-K
Cash from operations
0 of 2 years explained-
FY 2026 -14.2%
The FY 2026 MD&A has no sentence that names a cause for this change.
-
FY 2025 +52.9%
The FY 2025 MD&A has no sentence that names a cause for this change.
Changes are computed from the XBRL figures in the same 10-K. Hover a number to see the line item. Open the 10-K
Sources
The Management's Discussion and Analysis (Item 7) of the latest 10-K, quoted word for word; the changes are computed from the same 10-K's XBRL.
Also
Financials: the numbers year by year.
Work with it
Excel workbook · CSV. Google Sheet that stays up to date: paste =IMPORTDATA("https://tickdelta.com/company/NXT/export.csv") into a cell.