Paragraph 7 · 48% changed
Every version of it
Screener
/
SEC EDGAR
/CIK 0000898174
/10-K filed Feb 20, 2026, compared with Feb 21, 2025
/Numbers from the XBRL of the 10-Ks
NYSE
Financials · Life Insurance
Reinsurance Group Of America Inc RGA
The 10-K against last year's
210 changes: 40 added, 21 removed, 144 reworded, 5 quiet changes
10-K Feb 20, 2026 vs Feb 21, 2025
Risk Factors
15.0%
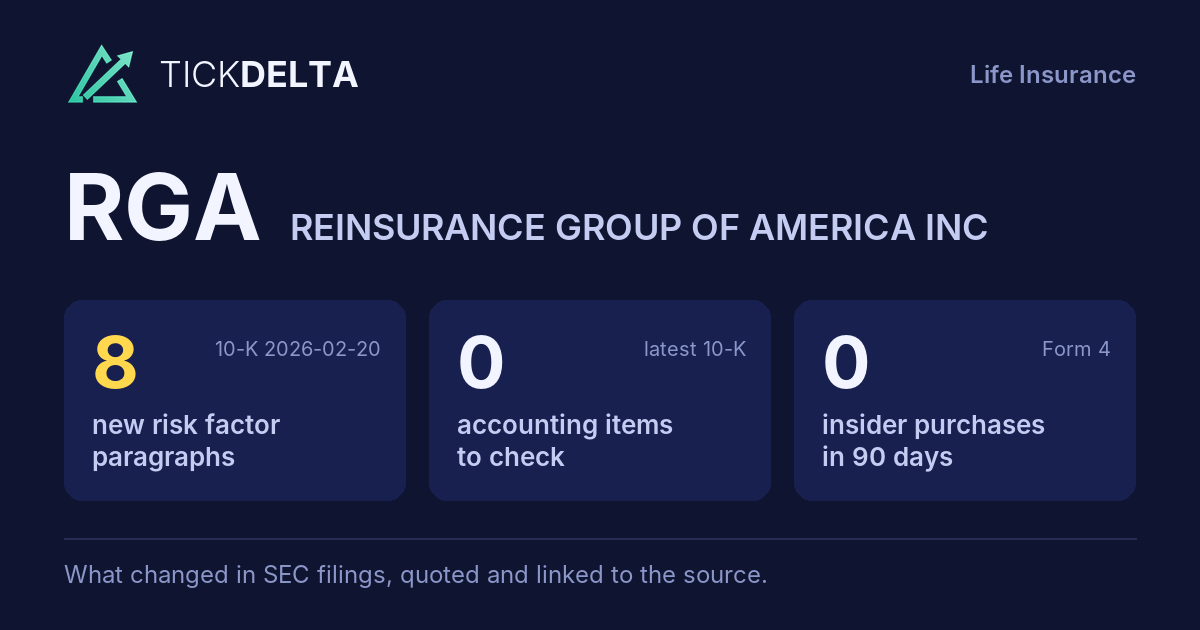
of the text changed · 12,470 words now · 8 new paragraphs, 4 gone
MD&A
17.1%
of the text changed · 28,451 words now · 32 new paragraphs, 17 gone
Legal Proceedings
13.8%
of the text changed · 673 words now
Accounting Policies
12.1%
of the text changed · 8,344 words now
10-K 0000898174-26-000006 (Feb 20, 2026) vs 10-K 0000898174-25-000027 (Feb 21, 2025)
Every paragraph, and how much of it changed
One bar per paragraph, in the order of the 10-K. Height and colour show the share of its words not in the closest paragraph a year earlier; the tallest bars are new paragraphs.
Risk Factors
131 paragraphs · 8 new · 60 reworded · 4 gone · 10-K Feb 20, 2026 against Feb 21, 2025
New paragraph
Reworded (5% of its words or more)
Same or nearly
Paragraph 50 · 48% changed
Every version of it
The insurance and reinsurance industries are subject to ongoing changes from market pressures brought about by customer demands, changes in law, changes in economic conditions such as interest rates and investment performance, technological innovation, marketing practices and new providers of insurance and reinsurance solutions. Failure to anticipate market trends or to differentiate our products and services may affect our ability to grow or maintain our current position in the industry. A failure by the insurance industry to meet evolving consumer demands, including demands to address disparate impacts that may exist against certain groups in insurers’ underwriting and sales models, could adversely affect the insurance industry and our operating results. Similarly, our failure to meet the changing demands of our insurance company clients through innovative product development, effective distribution channels and investments in technology could negatively impact our financial performance over the long-term. Additionally, our failure to adjust our strategies in response to changing economic conditions could impact our competitive position and have a material adverse effect on our business, financial condition and results of operations.
Paragraph 103 · 47% changed
Every version of it
Paragraph 51 · 46% changed
Every version of it
Paragraph 37 · 44% changed
Every version of it
A significant portion of our net premiums come comes from our operations outside of the U.S. One of In addition to the risks we are exposed to in our strategies is to grow U.S.-based operations, our non-U.S. based insurance subsidiaries are highly regulated and changes in these international operations. International operations subject us to various inherent risks. We may not be able to manage the growth of these operations effectively, particularly given the recent rates of growth. regulations could negatively affect our business. Our international operations expose us to mortality and morbidity experience, and supply and demand for our products that are specific to these markets as well as altered other risks, which may vary substantially by country, including political, financial or social instability or conditions, exposure to biometric, credit and other risks that may be difficult to anticipate. In addition to the macroeconomic environment in international markets, the regulatory environment and foreign currency risks identified above, other related risks include actions of non-U.S. governmental authorities, uncertainty arising out of foreign government sovereignty over our international operations, potentially uncertain or adverse tax consequences and potential reduction in opportunities resulting from market access restrictions.
Paragraph 6 · 37% changed
Every version of it
We regularly review our reserves and associated assumptions as well as actual compared to expected experience as part of our ongoing assessment of our business performance and risks. If we conclude determine that our reserves are insufficient to cover actual or expected policy and contract benefits and claim payments claims as a result of changes in experience, assumptions or otherwise, we would be required to increase our reserves and incur charges in the period in which we make the determination. our assumptions are updated. The amounts impacts of such increases may be significant, assumption updates and this could materially adversely affect our financial condition and results of operations variances from expected experience are reflected as future policy benefits remeasurement gains or losses, and may require us result in income statement volatility. Income statement volatility related to generate or fund additional capital assumption updates and variances from expected experience may cause income statement volatility primarily in our businesses. capped and floored cohorts.
Paragraph 58 · 35% changed
Every version of it
The U.S. Treasury Department and the IRS continue to issue guidance under the U.S. Tax Cuts and Jobs Act as well as Act, the Inflation Reduction Act passed in August 2022, Act, and the One Big Beautiful Bill Act, that may result in interpretations different from ours. Furthermore, Bermuda enacted the Corporate Income Tax of 2023 and the majority of the foreign jurisdictions in which the Company operates we operate enacted a global minimum tax. In addition, the Organization for Economic Cooperation and Development (“OECD”) has developed Model Global Anti-Base Erosion rules under Pillar II legislation, and additional countries in which we operate may also enact such legislation. These developments have resulted in increased tax expense and others are expected to enact a global minimum additional tax within a year. Guidance compliance burdens, and future guidance is expected to continue that which could result in further changes to global taxation and that materially affect our financial position and results of operations.
Paragraph 12 · 34% changed
Every version of it
Paragraph 7 · 48% changed
Every version of it
10-K Feb 21, 2025We regularly review our reserves and associated assumptions as part of our ongoing assessment of our business performance and risks. If we conclude that our reserves are insufficient to cover actual or expected policy and contract benefits and claim payments as a result of changes in experience, assumptions or otherwise, we would be required to increase our reserves and incur charges in the period in which we make the determination. The amounts of such increases may be significant, and this could materially adversely affect our financial condition and results of operations and may require us to generate or fund additional capital in our businesses.
10-K Feb 20, 2026
Unfavorable assumption updates and variances from expected experience may be significant, and this could materially adversely affect our financial condition and results of operations and may require us to generate or fund additional capital in our businesses.
Paragraph 50 · 48% changed
Every version of it
10-K Feb 21, 2025
The insurance and reinsurance industries are subject to ongoing changes from market pressures brought about by customer demands, changes in law, changes in economic conditions such as interest rates and investment performance, technological innovation, marketing practices and new providers of insurance and reinsurance solutions. Failure to anticipate market trends or to differentiate our products and services may affect our ability to grow or maintain our current position in the industry. A failure by the insurance industry to meet evolving consumer demands, including demands to address disparate impacts that may exist against certain groups in insurers’ underwriting and sales models, could adversely affect the insurance industry and our operating results. Similarly, our failure to meet the changing demands of our insurance company clients through innovative product development, effective distribution channels and investments in technology could negatively impact our financial performance over the long-term. Additionally, our failure to adjust our strategies in response to changing economic conditions could impact our competitive position and have a material adverse effect on our business, financial condition and results of operations.
10-K Feb 20, 2026
The insurance and reinsurance industries are subject to ongoing changes from market pressures brought about by customer demands, changes in law, changes in economic conditions such as interest rates and investment performance, technological innovation, marketing practices and new providers of insurance and reinsurance solutions. Failure to anticipate
Paragraph 103 · 47% changed
Every version of it
10-K Feb 21, 2025There may be illiquid markets for certain investments we hold in our investment portfolio. These include privately-placed fixed maturity securities, options and other derivative instruments, mortgage loans, policy loans, limited partnership interests, and real estate equity, such as real estate joint ventures and funds. Additionally, markets for certain of our investments that are currently liquid may experience reduced liquidity during periods of market volatility or disruption. If we were forced to sell certain of our investments into illiquid markets, prices may be lower than our carrying value in such investments. This could result in realized losses which could have a material adverse effect on our results of operations and financial condition, as well as our financial ratios, which could affect compliance with our credit instruments and rating agency capital adequacy measures.
10-K Feb 20, 2026
investments. This could result in realized losses which could have a material adverse effect on our results of operations and financial condition, as well as our financial ratios, which could affect compliance with our credit instruments and rating agency capital adequacy measures.
Paragraph 51 · 46% changed
Every version of it
10-K Feb 21, 2025The insurance and reinsurance industries are subject to ongoing changes from market pressures brought about by customer demands, changes in law, changes in economic conditions such as interest rates and investment performance, technological innovation, marketing practices and new providers of insurance and reinsurance solutions. Failure to anticipate market trends or to differentiate our products and services may affect our ability to grow or maintain our current position in the industry. A failure by the insurance industry to meet evolving consumer demands, including demands to address disparate impacts that may exist against certain groups in insurers’ underwriting and sales models, could adversely affect the insurance industry and our operating results. Similarly, our failure to meet the changing demands of our insurance company clients through innovative product development, effective distribution channels and investments in technology could negatively impact our financial performance over the long-term. Additionally, our failure to adjust our strategies in response to changing economic conditions could impact our competitive position and have a material adverse effect on our business, financial condition and results of operations.
10-K Feb 20, 2026
market trends or to differentiate our products and services may affect our ability to grow or maintain our current position in the industry. Federal and state regulators are increasing their scrutiny of insurers’ underwriting, and pricing practices, including the use of artificial intelligence, predictive models, and non-traditional data sources, due to concerns that such practices may create unfair discrimination or disparate impacts on certain groups. Regulatory standards in this area are rapidly evolving and may be subject to differing interpretations. As a result, we may be required to change our models, data sources, underwriting practices, incur significant compliance and governance costs, or face regulatory examinations, investigations, enforcement actions, penalties, litigation, or reputational harm, any of which could adversely affect our financial performance over the long-term. Additionally, our failure to adapt our strategies in response to changing economic conditions or changing competitive dynamics could impact our competitive position and have a material adverse effect on our business, financial condition and results of operations.
Paragraph 37 · 44% changed
Every version of it
10-K Feb 21, 2025
A significant portion of our net premiums come from our operations outside of the U.S. One of our strategies is to grow these international operations. International operations subject us to various inherent risks. We may not be able to manage the growth of these operations effectively, particularly given the recent rates of growth. Our international operations expose us to mortality and morbidity experience, and supply and demand for our products that are specific to these markets as well as altered exposure to biometric, credit and other risks that may be difficult to anticipate. In addition to the regulatory and foreign currency risks identified above, other related risks include uncertainty arising out of foreign government sovereignty over our international operations, potentially uncertain or adverse tax consequences and potential reduction in opportunities resulting from market access restrictions.
10-K Feb 20, 2026
A significant portion of our net premiums comes from our operations outside of the U.S. In addition to the risks we are exposed to in our U.S.-based operations, our non-U.S. based insurance subsidiaries are highly regulated and changes in these regulations could negatively affect our business. Our international operations expose us to other risks, which may vary substantially by country, including political, financial or social instability or conditions, exposure to the macroeconomic environment in international markets, the regulatory environment and actions of non-U.S. governmental authorities, uncertainty arising out of foreign government sovereignty over our international operations, potentially uncertain or adverse tax consequences and potential reduction in opportunities resulting from market access restrictions.
Paragraph 6 · 37% changed
Every version of it
10-K Feb 21, 2025
We regularly review our reserves and associated assumptions as part of our ongoing assessment of our business performance and risks. If we conclude that our reserves are insufficient to cover actual or expected policy and contract benefits and claim payments as a result of changes in experience, assumptions or otherwise, we would be required to increase our reserves and incur charges in the period in which we make the determination. The amounts of such increases may be significant, and this could materially adversely affect our financial condition and results of operations and may require us to generate or fund additional capital in our businesses.
10-K Feb 20, 2026
We regularly review our reserves and associated assumptions as well as actual compared to expected experience as part of our ongoing assessment of our business performance and risks. If we determine that our reserves are insufficient to cover actual or expected policy and contract benefits and claims as a result of changes in experience, assumptions or otherwise, we would be required to increase our reserves and incur charges in the period in which our assumptions are updated. The impacts of assumption updates and variances from expected experience are reflected as future policy benefits remeasurement gains or losses, and may result in income statement volatility. Income statement volatility related to assumption updates and variances from expected experience may cause income statement volatility primarily in capped and floored cohorts.
Paragraph 58 · 35% changed
Every version of it
10-K Feb 21, 2025
The U.S. Treasury Department and the IRS continue to issue guidance under the U.S. Tax Cuts and Jobs Act as well as the Inflation Reduction Act passed in August 2022, that may result in interpretations different from ours. Furthermore, the majority of the foreign jurisdictions in which the Company operates enacted a global minimum tax and others are expected to enact a global minimum tax within a year. Guidance is expected to continue that could result in further changes to global taxation and materially affect our financial position and results of operations.
10-K Feb 20, 2026
The U.S. Treasury Department and the IRS continue to issue guidance under the U.S. Tax Cuts and Jobs Act, the Inflation Reduction Act, and the One Big Beautiful Bill Act, that may result in interpretations different from ours. Furthermore, Bermuda enacted the Corporate Income Tax of 2023 and the majority of the foreign jurisdictions in which we operate enacted a global minimum tax. In addition, the Organization for Economic Cooperation and Development (“OECD”) has developed Model Global Anti-Base Erosion rules under Pillar II legislation, and additional countries in which we operate may also enact such legislation. These developments have resulted in increased tax expense and additional tax compliance burdens, and future guidance is expected which could result in further changes to taxation that materially affect our financial position and results of operations.
Paragraph 12 · 34% changed
Every version of it
10-K Feb 21, 2025COVID-19 increased mortality rates in certain jurisdictions and populations. Additionally, COVID-19 and the response thereto caused significant disruption in the international and U.S. economies and financial markets and severely impacted, global economic conditions, which resulted in substantial volatility in the global financial markets, increased unemployment and operational challenges such as the temporary closures of businesses, sheltering-in-place directives and increased remote work protocols. An increase in the number of future COVID-19 cases or a future epidemic or pandemic may again raise mortality rates in certain jurisdictions and populations and cause additional disruptions in international and U.S. economies and financial markets, which could severely impact our business, results of operations and financial condition. Future increases in COVID-19 cases or the severity of prevalent virus strains, the availability, effectiveness and use of treatments and vaccines, and the extent and success of actions by governments and central banks, the adverse mortality rates and impact on the global economy may deepen, and our results of operations and financial condition in future quarters may be adversely affected. Additionally, the long-term health consequences for individuals who have recovered from COVID-19 and the related impact, if any, on mortality and morbidity are all unknown.
10-K Feb 20, 2026
A future epidemic, pandemic or an increase in the number of future COVID-19 cases may again impact mortality rates in certain jurisdictions and populations and cause additional disruptions in international and U.S. economies and financial markets, which could severely impact our business, results of operations and financial condition. Additionally, the long-term health consequences for individuals who have recovered from COVID-19 and the related impact, if any, on mortality and morbidity are unknown.
MD&A
423 paragraphs · 32 new · 194 reworded · 17 gone · 10-K Feb 20, 2026 against Feb 21, 2025
New paragraph
Reworded (5% of its words or more)
Same or nearly
Paragraph 145 · 50% changed
•The decrease in net premiums was the result of lower contributions from primarily driven by larger single premium asset-intensive transactions, PRT transactions executed in the prior year, partially offset by contributions from new asset-intensive transactions. premiums related to the Equitable Holdings transaction in the current period.
Paragraph 261 · 49% changed
RGA, the obligor, is a party Inc. and several of its subsidiaries, are obligors to a various capital maintenance agreement agreements with its subsidiary, RGA Life and Annuity, the beneficiary. subsidiaries. Under this agreement, these agreements, the obligor guarantees for specified periods of time (depending on jurisdiction) that the beneficiary applicable subsidiary will meet specified capital and surplus levels. RGA Given the amount of business that has been and is expected to be written by the applicable subsidiaries benefiting from these agreements, the Company anticipates that in the event this arrangement places demand on it, there obligors will be have sufficient liquidity and capital to meet such demand. any obligations under these agreements.
Paragraph 105 · 47% changed
Paragraph 6 · 46% changed
Paragraph 268 · 46% changed
Paragraph 181 · 46% changed
•The decrease increase in the loss ratio was primarily due to an improvement in unfavorable assumption updates attributable to updated long-term mortality experience primarily assumptions in the UK and South Africa. U.K.
Paragraph 140 · 46% changed
•The reduction in future policy benefits remeasurement gain gains was due to lower remeasurement gains recognized in 2024 was attributable to favorable impacts the current year as a result of management in force actions and net favorable assumption updates, partially actions, offset by a remeasurement loss in the amount of $83 million as a result unfavorable impact of the change in the Company’s per life retention limit. The future policy benefits remeasurement loss limit in 2023 was attributable to unfavorable assumption updates of $17 million and unfavorable claims experience, primarily for the U.S. Individual Life business. prior year.
Paragraph 80 · 45% changed
Paragraph 145 · 50% changed
10-K Feb 21, 2025
•The decrease in net premiums was the result of lower contributions from single premium asset-intensive transactions, partially offset by contributions from new asset-intensive transactions.
10-K Feb 20, 2026
•The decrease in net premiums was primarily driven by larger single premium PRT transactions executed in the prior year, partially offset by premiums related to the Equitable Holdings transaction in the current period.
Paragraph 261 · 49% changed
10-K Feb 21, 2025
RGA, the obligor, is a party to a capital maintenance agreement with its subsidiary, RGA Life and Annuity, the beneficiary. Under this agreement, the obligor guarantees for specified periods of time that the beneficiary will meet specified capital and surplus levels. RGA anticipates that in the event this arrangement places demand on it, there will be sufficient liquidity and capital to meet such demand.
10-K Feb 20, 2026
RGA, Inc. and several of its subsidiaries, are obligors to various capital maintenance agreements with its subsidiaries. Under these agreements, the obligor guarantees for specified periods of time (depending on jurisdiction) that the applicable subsidiary will meet specified capital and surplus levels. Given the amount of business that has been and is expected to be written by the applicable subsidiaries benefiting from these agreements, the Company anticipates that the obligors will have sufficient liquidity and capital to meet any obligations under these agreements.
Paragraph 105 · 47% changed
10-K Feb 21, 2025See “Segment Accounting Policies” within Note 19 – “Segment Information” in the Notes to Consolidated Financial Statements for additional information regarding the presentation of segment results and the Company’s definition of adjusted operating income.
10-K Feb 20, 2026
Adjusted operating income (loss) before income taxes, when presented at a segment level, is a measure reported to management for purposes of making decisions about allocating resources to the Company’s business segments and assessing the performance of the business segments, and is presented in the Company’s financial statement footnotes in accordance with U.S. GAAP. For additional information, including regarding the presentation of segment results and the Company’s definition of adjusted operating income at a segment level, see Note 19 – “Segment Information” in the Notes to Consolidated Financial Statements. Adjusted operating income before income taxes, when presented on a consolidated basis, is a non-GAAP financial measure.
Paragraph 6 · 46% changed
10-K Feb 21, 2025including ongoing uncertainties regarding the amount of U.S. sovereign debt and the credit ratings thereof, (17) the Company’s dependence on third parties, including those insurance companies and reinsurers to which the Company cedes some reinsurance, third-party investment managers and others, (18) financial performance of the Company’s clients, (19) the threat of natural disasters, catastrophes, terrorist attacks, pandemics, epidemics or other major public health issues anywhere in the world where the Company or its clients do business, (20) competitive factors and competitors’ responses to the Company’s initiatives, (21) development and introduction of new products and distribution opportunities, (22) execution of the Company’s entry into new markets, (23) integration of acquired blocks of business and entities, (24) interruption or failure of the Company’s telecommunication, information technology or other operational systems, or the Company’s failure to maintain adequate security to protect the confidentiality or privacy of personal or sensitive data and intellectual property stored on such systems, (25) adverse developments with respect to litigation, arbitration or regulatory investigations or actions (26) the adequacy of reserves, resources and accurate information relating to settlements, awards and terminated and discontinued lines of business, (27) changes in laws, regulations, and accounting standards applicable to the Company or its business, including Long Duration Targeted Improvement accounting changes and (28) other risks and uncertainties described in this document and in the Company’s other filings with the Securities and Exchange Commission (“SEC”).
10-K Feb 20, 2026
epidemics, other major health issues, natural disasters, war, military actions, and terrorism or other acts of violence; (11) competitive factors and competitors’ responses to the Company’s initiatives; (12) development and introduction of new products and distribution opportunities and entry into new lines of business and markets; (13) the impact of the development and adoption of artificial intelligence; (14) the effect of acquisitions and other significant transactions, including risks related to the integration of acquired blocks of business and entities and the Company’s ability to achieve the expected benefits of such transactions, including the transaction entered into with subsidiaries of Equitable Holdings, Inc. on July 31, 2025; (15) interruption or failure of the Company’s telecommunication, information technology, or other operational systems, or the Company’s failure to maintain adequate security to protect the confidentiality or privacy of personal or sensitive data and intellectual property stored on such systems; (16) adverse developments with respect to litigation, arbitration, or regulatory investigations or actions; (17) risks associated with our international operations, including related to fluctuation in foreign currency exchange rates; and (18) other risks and uncertainties described in this document and in the Company’s other filings with the Securities and Exchange Commission (“SEC”).
Paragraph 268 · 46% changed
10-K Feb 21, 2025On March 13, 2023, the Company entered into a syndicated revolving credit facility with a five year term and an overall capacity of $850 million. As of December 31, 2024, the Company had no cash borrowings outstanding and no issued, but undrawn, letters of credit under this facility.
10-K Feb 20, 2026
•Revolving credit facility – Drawing funds under a syndicated revolving credit facility, under which the Company had availability of $850 million as of December 31, 2025. As of December 31, 2025, the Company had no amounts outstanding under the revolving credit facility.
Paragraph 181 · 46% changed
10-K Feb 21, 2025
•The decrease in the loss ratio was due to an improvement in mortality experience primarily in the UK and South Africa.
10-K Feb 20, 2026
•The increase in the loss ratio was primarily due to unfavorable assumption updates attributable to updated long-term mortality assumptions in the U.K.
Paragraph 140 · 46% changed
10-K Feb 21, 2025
•The future policy benefits remeasurement gain in 2024 was attributable to favorable impacts of management in force actions and net favorable assumption updates, partially offset by a remeasurement loss in the amount of $83 million as a result of the change in per life retention limit. The future policy benefits remeasurement loss in 2023 was attributable to unfavorable assumption updates of $17 million and unfavorable claims experience, primarily for the U.S. Individual Life business.
10-K Feb 20, 2026
•The reduction in future policy benefits remeasurement gains was due to lower remeasurement gains recognized in the current year as a result of management in force actions, offset by the unfavorable impact of the change in the Company’s per life retention limit in the prior year.
Paragraph 80 · 45% changed
10-K Feb 21, 2025•During the third quarter of 2024 and 2023, the Company completed its annual assumption review resulting in an immaterial change in assumptions compared to a $34 million gain recognized in 2023.
10-K Feb 20, 2026
During the third quarter of 2025 and 2024, the Company completed its annual assumptions review resulting in a pre-tax loss of $149 million and $194 million, respectively. The pre-tax loss recognized in 2025 was primarily due to updated mortality assumptions in the U.K. The 2024 pre-tax loss, which was comprised of a $219 million loss related to long-duration business and a $25 million gain on other business, was the result of the Company increasing its retention limit from $8 million to $30 million resulting in a pre-tax loss of $136 million, and updated mortality and lapse assumptions resulting in a pre-tax loss of $58 million.
A paragraph is matched with the one last year that shares the most of its words; under half in common makes it new. The paragraphs shown are the 8 reworded the most in each section.
The paragraph that changed most in each section
The redline
Marked against last year's 10-K: cut words struck through, new words highlighted.
MD&A416 words changed in this paragraph; it is 39% similar to last year's version.
Factors that could also cause results or events to differ, possibly materially, from those expressed or implied by forward-looking statements, include, among others: (1) adverse changes in mortality (whether related to COVID-19 or otherwise), mortality, morbidity, lapsation or policyholder behavior, claims experience, investment returns, interest rates, expenses and other factors as compared to our pricing assumptions; (2) inadequate risk analysis investment results, whether from changes in economic, capital- and underwriting, (3) adverse capital and credit market conditions credit-market conditions, asset selection, or otherwise, and their impact on the Company’s investment securities, liquidity, portfolio yields, credit quality, access to capital and capital, cost of capital, (4) and amount of capital required for regulatory and contractual purposes; (3) changes in the Company’s financial strength and credit ratings and the effect of such changes on the Company’s future results of operations Company; (4) the availability, amount, cost, and financial condition, (5) the availability and cost market value of collateral necessary for regulatory reserves reserves, capital, and capital, (6) requirements to post collateral or make payments due to declines client obligations; (5) changes in the market value of assets subject laws and regulations, tax policy and rates, accounting standards, and privacy, data security and cybersecurity regulations applicable to the Company’s collateral arrangements, (7) action Company and actions by regulators who have with authority over the Company’s reinsurance operations in the jurisdictions in which it operates, (8) the effect of the Company parent’s status operations, as an insurance holding company and well as regulatory restrictions on its the ability of Company subsidiaries to pay principal dividends to the Company; (6) the impact of and interest on its debt obligations, (9) general economic conditions in the U.S. and globally, including as a result of inflation, interest rate levels, geopolitical instability, and impacts from the imposition of, or a prolonged economic downturn changes in tariffs, as well as the stability of and actions by governments, central banks, and economies in jurisdictions where the Company operates, affecting interest rates, markets generally, or the demand for insurance and reinsurance in reinsurance; (7) the stability and financial performance of clients, reinsurers, third-party investment managers and other institutions and the effects of the Company’s current and planned markets, (10) dependence on such third parties; (8) the impairment effectiveness of other financial institutions and its effect on the Company’s business, (11) fluctuations in U.S. risk management strategy, policy, and procedures, whether relating to reinsurance, investment strategy, operations, or foreign currency exchange rates, interest rates, or securities and real estate markets, (12) market or economic conditions that adversely affect otherwise; (9) the impact of impairments of the value of the Company’s investment securities or result in the impairment of all or a portion of the value of certain of on the Company’s investment securities that in turn could affect regulatory capital, (13) market or economic conditions that adversely affect the Company’s ability to make timely sales of investment securities, (14) risks inherent in the Company’s risk management capital requirements and investment strategy, including changes in investment portfolio yields due to interest rate or credit quality changes, (15) the fact that the determination of allowances and impairments taken on the Company’s investments is highly subjective, (16) subjective; (10) the stability threat of and actions by governments and economies in the markets in which the Company operates, catastrophic events such as pandemics,
Source: Item 7, 10-K 0000898174-26-000006 vs Item 7, 10-K 0000898174-25-000027
Risk Factors242 words changed in this paragraph; it is 59% similar to last year's version.
Our business is highly dependent upon the effective operation of our computer information security systems. The failure of our computer information security systems or disaster recovery capabilities for any reason could cause significant interruptions in our operations and result in a failure to maintain the security, confidentiality, integrity or privacy of sensitive or personal data related to our customers, insured individuals or employees. Like other global companies, we have experienced threats are regularly the target of cybersecurity attacks and other attempts to gain unauthorized access to, or breach our data and systems from time and cybersecurity threats are becoming more frequent and sophisticated. In addition, the rapid evolution and increased adoption of artificial intelligence technologies may heighten our cybersecurity risks by making cybersecurity attacks more difficult to time. However, we have not detected or identified any evidence to indicate we have experienced a material breach of cybersecurity. detect, contain and mitigate. Administrative and technical controls, security measures and other preventative actions we take to reduce the risk of such incidents and protect our information technology may not be sufficient to prevent physical and electronic break-ins, and similar disruptions from unauthorized tampering with our computer and information security systems. Despite our continued efforts, cybersecurity threats are becoming more frequent and sophisticated. Failure we have experienced security incidents from time to stay ahead of such advances has led to and time. Any failure in our security measures could lead to the misappropriation, intentional or unintentional unauthorized disclosure or misuse of personal data that we or our vendors store and process. Such If our information security systems or the information systems of any third parties with which we interact, are disrupted or compromised, in a failure manner which impacts us or our information security systems, as a result of a cybersecurity attack, a security incident, including a data breach, or other security incident could result in liabilities and penalties, have an adverse impact on our financial results and growth prospects, cause interruption of normal business operations, cause us to incur substantial costs, harm our reputation, subject us to investigations, litigation, regulatory sanctions and other claims and expenses, lead to loss of customers and revenues and otherwise adversely affect our business, financial condition or results of operations. Additionally, we are subject to cybersecurity reporting obligations in different jurisdictions that vary in their scope and application, which may create conflicting reporting obligations and inhibit our ability to quickly provide complete and reliable information to business relations and regulators, as well as the public.
Source: Item 1A, 10-K 0000898174-26-000006 vs Item 1A, 10-K 0000898174-25-000027
Accounting Policies159 words changed in this paragraph; it is 33% similar to last year's version.
Utilizing the net premium model, a liability for future policy benefits for life, pension risk transfer transactions, transactions and long-term health business is established to meet the estimated future benefits to be paid on assumed life and health reinsurance in force less the present value of estimated future new premiums to be collected. The liability is estimated using the Company’s mortality, morbidity, and persistency assumptions that reflect the Company’s historical experience, industry data, cedant specific experience, and discount rates based on the current yields of upper-medium grade fixed income instruments. These assumptions vary with the characteristics of the reinsurance contract, the year the risk was assumed, age of the insured and other appropriate factors. The Company reviews actual and anticipated experience compared to the assumptions used to establish policy benefits on a quarterly basis and will update those assumptions if evidence suggests that they should be revised. The Company completed its annual review and any necessary updates of cash flow assumptions used to calculate the liability for future policy benefits during the third quarter of 2024 and 2023. Updates may occur in other quarters if information becomes available during the quarter that indicates an assumption update is necessary.
Source: Item 8, Note 2 – SIGNIFICANT ACCOUNTING POLICIES AND PRONOUNCEMENTS, 10-K 0000898174-26-000006 vs Item 8, Note 2 – SIGNIFICANT ACCOUNTING POLICIES AND PRONOUNCEMENTS, 10-K 0000898174-25-000027
Legal Proceedings83 words changed in this paragraph; it is 31% similar to last year's version.
Source: Item 3, via Note 17 – COMMITMENTS, CONTINGENCIES AND GUARANTEES, 10-K 0000898174-26-000006 vs Item 3, via Note 17 – COMMITMENTS, CONTINGENCIES AND GUARANTEES, 10-K 0000898174-25-000027
Sentences and paragraphs added, removed or reworded
Every change, by type
Sentences and paragraphs of RGA's Risk Factors and MD&A, 10-K Feb 20, 2026 against 10-K Feb 21, 2025. Each links to the text at sec.gov.
Quiet changes are sentences kept from last year with one to four words changed, at least one of them a hedge, a modal or a qualifier (may, could, will, not, significant, material…). A year or date rolling forward is not counted.
The full word list
adverse, adversely, all, although, anticipate, anticipates, any, approximately, believe, believes, can, cannot, certain, could, expect, expects, generally, however, if, intend, intends, largely, likely, many, material, materially, may, might, most, must, never, no, not, possible, primarily, probable, should, significant, significantly, some, substantial, substantially, unlikely, will, would
AddedRisk Factors
We have made, and may in the future make, acquisitions, either of selected blocks of business or other companies, such as our reinsurance transaction with subsidiaries of Equitable Holdings, Inc. that closed on July 31, 2025. In connection with these transactions our employees, outside consultants and legal advisors evaluated important and complex actuarial, investment, business, finance, tax, accounting, legal and regulatory issues. Our due diligence efforts may not have been complete or accurate and may not have identified all relevant facts, which could prevent us from realizing the anticipated benefits of any such transaction. To the extent that our assumptions about a transaction prove to be materially inaccurate, our counterparties to those transactions do not meet their obligations to us, or we experience difficulty in integrating the risks assumed, our business, financial condition and results of operations could be adversely affected.
Read it in 10-K Feb 20, 2026 at sec.gov
AddedRisk Factors
The development and adoption of artificial intelligence and its use and anticipated use by us or by third parties on whom we rely, may increase the operational risks discussed above or create new operational risks that we are not currently anticipating, which may otherwise adversely impact us.
Read it in 10-K Feb 20, 2026 at sec.gov
AddedRisk Factors
Artificial intelligence technologies offer potential benefits in areas such as customer service personalization and process automation, and we use, and expect to increasingly use, artificial intelligence to help deliver products and services and support critical functions. We also expect third parties on whom we rely to do the same. While we maintain processes to evaluate, manage and oversee risks related to the use of these artificial intelligence systems, they are developed, designed, and operated outside of our direct control. There are significant risks involved in developing and deploying artificial intelligence and there can be no assurance that using artificial intelligence will benefit our operations. Our efforts to integrate artificial intelligence technologies into our operations may result in unanticipated consequences and complications, and if we do not successfully implement artificial intelligence technologies, this could result in legal and regulatory risk, and otherwise adversely affect us. Moreover, artificial intelligence may be misused by us or by third-party service providers, and that risk is increased by the relative newness of the technology, and the speed at which it is being adopted. Such misuse could expose us to legal or regulatory risk, damage customer relationships or cause reputational harm.
Read it in 10-K Feb 20, 2026 at sec.gov
AddedRisk Factors
Further, if these systems fail, are compromised, or operate in ways that are inconsistent with our expectations, we could experience operational disruptions, incur liabilities, or suffer regulatory or reputational harm. Additionally, our ability to continue to develop and efficiently deploy artificial intelligence technologies depends on our ability to attract and retain skilled talent as well as access to specific third-party equipment and other physical infrastructure, such as processing hardware and network capacity, for which we cannot control the availability or pricing, especially in a highly competitive environment.
Read it in 10-K Feb 20, 2026 at sec.gov
AddedRisk Factors
In addition, the legal and regulatory framework with respect to artificial intelligence is evolving and remains uncertain. We expect that additional laws, regulations, and policies related to artificial intelligence will be enacted, and existing laws and regulations may be interpreted in new ways, which could affect our operations. Further, there is uncertainty regarding the impact of state laws related to artificial intelligence as the result of an executive order issued by the current presidential administration in December 2025, which directs federal regulators to challenge and preempt state laws that the administration views as obstructive to artificial intelligence innovation. If we are unable to use artificial intelligence technology in our operations as a result of such legal restrictions, or if regulations on artificial intelligence require additional compliance or reporting obligations, our business operations in certain regions could be adversely impacted. Further, any failure or perceived failure by us to comply with legal requirements related to artificial intelligence could result in proceedings, investigations or actions against us, and which may otherwise adversely impact us.
Read it in 10-K Feb 20, 2026 at sec.gov
AddedRisk Factors
There has been increased scrutiny, including from U.S. state and foreign regulators, regarding the use of “big data” techniques, including machine learning. For instance, the New York State Department of Financial Services (“NYDFS”) Part 500 Cybersecurity Regulation (the “Cybersecurity Regulation”) applies to us because one of our insurance subsidiaries is licensed in New York. Additionally, the Cybersecurity Regulation also applies to many of our clients. The Cybersecurity
Read it in 10-K Feb 20, 2026 at sec.gov
AddedRisk Factors
We include equity and alternative assets (including private equity, hedge funds and real estate joint ventures) in our portfolio constructions, as these asset classes can provide an increase in returns over longer periods of time, aligning with the long-term nature of certain of our liabilities. Private debt and equity investments and real estate joint ventures have less price transparency than publicly traded securities. As these investments typically do not trade on public markets and indications of realizable market value may not be readily available, valuations can be infrequent or more volatile.
Read it in 10-K Feb 20, 2026 at sec.gov
AddedRisk Factors
stated on our balance sheet at fair value. The performance of our mortgage loan investments and our investments in CMBS and RMBS, however, may fluctuate in the future. An increase in the default rate of our mortgage loan investments or the mortgage loans underlying our investments in CMBS and RMBS could have a material adverse effect on our financial condition or results of operations.
Read it in 10-K Feb 20, 2026 at sec.gov
Show the other 57
RemovedRisk Factors
RemovedRisk Factors
RemovedRisk Factors
RemovedRisk Factors
RewordedRisk Factors
RewordedRisk Factors
Furthermore, Bermuda enacted the Corporate Income Tax of 2023 and the majority of the foreign jurisdictions in which the Company operates we operate enacted a global minimum tax and others are expected to enact a global minimum tax within a year. tax.
Read it in 10-K Feb 20, 2026 at sec.gov
RewordedRisk Factors
RewordedRisk Factors
There may be illiquid markets for certain investments we hold in our investment portfolio. portfolio as result of changes in interest rates, reduced liquidity in the financial markets or a slow down in the U.S. or global economy.
Read it in 10-K Feb 20, 2026 at sec.gov
RewordedRisk Factors
RewordedRisk Factors
RewordedRisk Factors
Tax Cuts and Jobs Act as well as Act, the Inflation Reduction Act passed in August 2022, Act, and the One Big Beautiful Bill Act, that may result in interpretations different from ours.
Read it in 10-K Feb 20, 2026 at sec.gov
RewordedRisk Factors
RewordedRisk Factors
RewordedRisk Factors
RewordedRisk Factors
Our failure to adhere to any existing or new guidelines could subject us to litigation, investigation, sanctions, and enforcement actions, resulting in reputational harm or otherwise have a material impact on new and existing business, our financial condition and results of operations.
Read it in 10-K Feb 20, 2026 at sec.gov
RewordedRisk Factors
Quiet changesRisk Factors
Changes in economic conditions may lead to changes in market interest rates or changes in our investment strategies, either of which could cause our actual investment returns and expenses to differ materially from our pricing and reserve assumptions.
Read it in 10-K Feb 20, 2026 at sec.gov
Quiet changesRisk Factors
Additionally, the long-term health consequences for individuals who have recovered from COVID-19 and the related impact, if any, on mortality and morbidity are all unknown.
Read it in 10-K Feb 20, 2026 at sec.gov
Quiet changesRisk Factors
In addition, there are may be ongoing risks around the world related to interest rate fluctuations, slowing global growth, commodity prices and the devaluation of certain currencies.
Read it in 10-K Feb 20, 2026 at sec.gov
Quiet changesRisk Factors
Changes in interest rates, reduced liquidity in the financial markets or a slowdown in U.S. or global economic conditions have adversely affected, and, in the future, may also adversely affect the values and cash flows of the assets in our investment portfolio.
Read it in 10-K Feb 20, 2026 at sec.gov
AddedMD&A
The Company continues to lead with expertise and innovation by prioritizing speed, impact, scale and sustainability, which enables it to deliver on its purpose to make financial protection accessible to all. The Company is well positioned to meet its clients’ needs through the following initiatives.
Read it in 10-K Feb 20, 2026 at sec.gov
AddedMD&A
A discussion of the Company’s financial condition and results of operations for the year ended December 31, 2025, compared to the year ended December 31, 2024, is presented below. A discussion of the Company’s financial condition and results of operations for the year ended December 31, 2024, compared to the year ended December 31, 2023, can be found under Item 7 in the Company’s Annual Report on Form 10-K for the year ended December 31, 2024, filed with the SEC on February 21, 2025, which is available free of charge on the SEC’s website at ww.sec.gov and the Company’s Investor Relations website at www.rgare.com. Information provided on such website does not constitute part of this Annual Report on Form 10-K.
Read it in 10-K Feb 20, 2026 at sec.gov
AddedMD&A
The Company uses best estimate assumptions for future cash flows for its long-duration insurance business, and the impact of assumption updates is reflected as liability remeasurement gains or losses in the income statement based on treaty issue-year cohorts. As a result, best estimate assumption updates, as well as actual versus expected experience, on these long-duration contracts may result in current period income statement volatility.
Read it in 10-K Feb 20, 2026 at sec.gov
AddedMD&A
The relative impact on current period income statement results from assumptions updates and actual versus expected experience will vary based on the net premium ratio of the affected cohort. The net premium ratio represents the portion of the gross premiums allocated to reserves to provide for all benefits and certain expenses in long-duration business.
Read it in 10-K Feb 20, 2026 at sec.gov
AddedMD&A
•Capped cohorts – Cohorts with a net premium ratio equal to or greater than 100%. Capped cohorts are approximately 9% of the Company’s cohorts and are predominantly associated with business in the Company’s U.S. and Latin America Traditional segment from 1999 to 2004.
Read it in 10-K Feb 20, 2026 at sec.gov
AddedMD&A
•Floored cohorts – Cohorts with reserves floored at zero as reserves cannot be negative. Floored cohorts are approximately 27% of the Company’s cohorts and are predominately associated with longevity business in the Company’s EMEA Financial Solutions business.
Read it in 10-K Feb 20, 2026 at sec.gov
AddedMD&A
•Uncapped cohorts – Cohorts with a net premium ratio under 100% are 64% of the Company’s cohorts.
Read it in 10-K Feb 20, 2026 at sec.gov
AddedMD&A
Actual versus expected experience variances in the Company’s capped and floored cohorts and assumption updates in the Company’s capped cohorts are expected to create more income statement volatility than the Company’s uncapped cohorts. This is because the full impact of the experience variance, for both capped and floored cohorts, and assumption updates, for capped cohorts is recognized in current period earnings due to the net premium ratio exceeding 100% or the reserve floored at zero. For uncapped cohorts, only a portion of the impact, based on the adjusted net premium ratio, is reflected in current period results and the remaining impact is recognized over the life of the cohort based on the net premium ratio and future expected cash flows.
Read it in 10-K Feb 20, 2026 at sec.gov
AddedMD&A
The following table summarizes the pre-tax impact of assumption updates for the years ended December 31, 2025 and 2024 for each segment’s long-duration insurance business (amounts in millions).
Read it in 10-K Feb 20, 2026 at sec.gov
AddedMD&A
•The execution of reinsurance contracts with subsidiaries of Equitable Holdings, Inc. (“Equitable Holdings”) on July 31, 2025. Pursuant to these agreements, the Company’s U.S. Financial Solutions segment assumed a 75% quota share of Equitable Holdings’ in force individual life insurance liabilities on a coinsurance and modified coinsurance basis, consisting of a diversified mix of life products and account value liabilities, with total liabilities of approximately $12 billion. This transaction increased income before income taxes by $68 million. In addition, pursuant to these
Read it in 10-K Feb 20, 2026 at sec.gov
AddedMD&A
agreements, Equitable Holdings recaptured risks previously assumed by the Company’s U.S. Traditional segment resulting in a gain of $21 million recognized in the current period.
Read it in 10-K Feb 20, 2026 at sec.gov
AddedMD&A
•Strong growth in the Company’s Traditional business in Asia and Financial Solutions business in the U.K.
Read it in 10-K Feb 20, 2026 at sec.gov
RemovedMD&A
RemovedMD&A
RemovedMD&A
RemovedMD&A
RemovedMD&A
RemovedMD&A
RemovedMD&A
RemovedMD&A
RemovedMD&A
RemovedMD&A
RemovedMD&A
RemovedMD&A
RewordedMD&A
For the year ended December 31, 2025 2024 2023 2022 2025 vs 2024 vs 2023 2023 vs 2022 Segment revenues Net premiums $ 1,291 3,335 $ 1,215 3,014 $ 1,219 $ 76 $ (4) 321 Net investment income 292 257 249 252 8 (3) 35 Investment related gains (losses), net 3 4 4 (1) 1 1 — Other revenues 6 4 4 2 — 13 25 (12) Total segment revenues 1,557 1,472 1,479 85 (7) 3,641 3,297 344 Adjusted benefits and expenses Adjusted claims and other policy benefits 1,194 1,130 1,129 64 1 2,883 2,582 301 Future policy benefits remeasurement (gains) losses (11) 22 (2) (33) 24 (93) 34 (127) Adjusted interest credited 1 1 — — 1 — Policy acquisition costs and other insurance expenses 186 184 203 2 (19) 156 168 (12) Other operating expenses 53 44 41 9 3 230 231 (1) Total adjusted benefits and expenses 1,423 1,381 1,371 42 10 3,176 3,015 161 Adjusted operating income before income taxes $ 134 465 $ 91 282 $ 108 $ 43 $ (17) 183 Key metrics Life reinsurance in force $474.2 $552.5 billion $493.5 billion $463.6 $567.6 billion Future policy benefits remeasurement (gains) losses Effect of changes in cash flow assumptions $ (2) (1) $ 13 $ 1 109 Effect of actual variances from expected experience $ (9) (92) $ 9 $ (3) (75) Loss ratio (1) 92 84 % 95 % 93 87 % Policy acquisition costs and other insurance expenses as a percentage of net premiums 14 5 % 15 % 17 6 % Other operating expenses as a percentage of net premiums 4 7 % 4 8 % 3 %
Read it in 10-K Feb 20, 2026 at sec.gov
RewordedMD&A
For the year ended December 31, 2025 2024 2023 2022 2025 vs 2024 vs 2023 2023 vs 2022 Segment revenues Net premiums $ 1,291 2,258 $ 1,215 2,002 $ 1,219 $ 76 $ (4) 256 Net investment income 257 249 252 8 (3) 129 112 17 Investment related gains (losses), net 3 4 4 (1) — — — Other revenues 6 4 4 2 — 10 11 (1) Total segment revenues 1,557 1,472 1,479 85 (7) 2,397 2,125 272 Adjusted benefits and expenses Adjusted claims and other policy benefits 1,194 1,130 1,129 64 1 2,074 1,805 269 Future policy benefits remeasurement (gains) losses (11) 22 (2) (33) 24 204 48 156 Adjusted interest credited 1 1 — — 1 — Policy acquisition costs and other insurance expenses 186 184 203 111 109 2 (19) Other operating expenses 53 44 41 9 3 114 133 (19) Total adjusted benefits and expenses 1,423 1,381 1,371 42 10 2,503 2,095 408 Adjusted operating income before income taxes $ 134 (106) $ 91 30 $ 108 $ 43 $ (17) (136) Key metrics Life reinsurance in force $474.2 $1,113.1 billion $493.5 billion $463.6 $970.4 billion Future policy benefits remeasurement (gains) losses Effect of changes in cash flow assumptions $ (2) 222 $ 13 $ 1 40 Effect of actual variances from expected experience $ (9) (18) $ 9 $ (3) 8 Loss ratio (1) 92 % 95 101 % 93 % Policy acquisition costs and other insurance expenses as a percentage of net premiums 14 5 % 15 % 17 5 % Other operating expenses as a percentage of net premiums 4 5 % 4 7 % 3 %
Read it in 10-K Feb 20, 2026 at sec.gov
RewordedMD&A
For the year ended December 31, 2025 2024 2023 2022 2025 vs 2024 vs 2023 2023 vs 2022 Segment revenues Net premiums $ 2,986 188 $ 1,521 166 $ 66 $ 1,465 $ 1,455 22 Net investment income 1,280 1,137 1,063 143 74 228 147 81 Investment related gains (losses), net — — — — 1 1 — Other revenues 226 221 263 5 (42) 13 17 (4) Total segment revenues 4,492 2,879 1,392 1,613 1,487 430 331 99 Adjusted benefits and expenses Adjusted claims and other policy benefits 3,187 1,646 205 1,541 1,441 368 307 61 Future policy benefits remeasurement (gains) losses 1 (29) (28) 30 (1) 3 — 3 Adjusted interest credited 519 531 539 (12) (8) — — — Policy acquisition costs and other insurance expenses 374 214 170 160 44 18 (7) 25 Other operating expenses 85 66 58 19 8 4 5 (1) Total adjusted benefits and expenses 4,166 2,428 944 1,738 1,484 393 305 88 Adjusted operating income before income taxes $ 326 37 $ 451 26 $ 448 $ (125) $ 3 11 Key metrics Future policy benefits remeasurement (gains) losses Effect of changes in cash flow assumptions $ 7 — $ (22) $ (4) — Effect of actual variances from expected experience $ (6) 3 $ (7) $ (24) —
Read it in 10-K Feb 20, 2026 at sec.gov
RewordedMD&A
For the year ended December 31, 2025 2024 2023 2022 2025 vs 2024 vs 2023 2023 vs 2022 Segment revenues Net premiums $ 2,986 959 $ 1,521 660 $ 66 $ 1,465 $ 1,455 299 Net investment income 1,280 1,137 1,063 143 74 435 319 116 Investment related gains (losses), net 2 — — — — — 2 Other revenues 226 221 263 5 (42) 51 34 17 Total segment revenues 4,492 2,879 1,392 1,613 1,487 1,447 1,013 434 Adjusted benefits and expenses Adjusted claims and other policy benefits 3,187 1,646 205 1,541 1,441 893 562 331 Future policy benefits remeasurement (gains) losses 1 (29) (28) 30 (1) (37) 3 (40) Adjusted interest credited 519 531 539 (12) (8) 26 30 (4) Policy acquisition costs and other insurance expenses 374 214 170 160 44 9 8 1 Other operating expenses 85 66 58 19 8 87 65 22 Total adjusted benefits and expenses 4,166 2,428 944 1,738 1,484 978 668 310 Adjusted operating income before income taxes $ 326 469 $ 451 345 $ 448 $ (125) $ 3 124 Key metrics Future policy benefits remeasurement (gains) losses Effect of changes in cash flow assumptions $ 7 (24) $ (22) $ (4) 3 Effect of actual variances from expected experience $ (6) (13) $ (7) $ (24) —
Read it in 10-K Feb 20, 2026 at sec.gov
RewordedMD&A
For the year ended December 31, 2025 2024 2023 2022 2025 vs 2024 vs 2023 2023 vs 2022 Segment revenues Net premiums $ 2,986 458 $ 1,521 224 $ 66 $ 1,465 $ 1,455 234 Net investment income 1,280 1,137 1,063 143 74 981 656 325 Investment related gains (losses), net — — — — — 42 20 22 Other revenues 226 221 263 5 (42) 24 57 (33) Total segment revenues 4,492 2,879 1,392 1,613 1,487 1,505 957 548 Adjusted benefits and expenses Adjusted claims and other policy benefits 3,187 1,646 205 1,541 1,441 613 308 305 Future policy benefits remeasurement (gains) losses 1 (29) (28) 30 (1) (9) 2 (11) Adjusted interest credited 519 531 539 (12) (8) 414 256 158 Policy acquisition costs and other insurance expenses 374 214 170 160 44 149 102 47 Other operating expenses 85 66 58 19 8 44 34 10 Total adjusted benefits and expenses 4,166 2,428 944 1,738 1,484 1,211 702 509 Adjusted operating income before income taxes $ 326 294 $ 451 255 $ 448 $ (125) $ 3 39 Key metrics Future policy benefits remeasurement (gains) losses Effect of changes in cash flow assumptions $ 7 — $ (22) $ (4) 9 Effect of actual variances from expected experience $ (6) (9) $ (7) $ (24)
Read it in 10-K Feb 20, 2026 at sec.gov
RewordedMD&A
For the year ended December 31, 2025 2024 2023 2022 2025 vs 2024 vs 2023 2023 vs 2022 Segment revenues Net premiums $ 7,927 $ 7,500 $ 7,023 $ 6,590 $ 477 $ 433 427 Net investment income 1,134 881 779 900 102 (121) 253 Investment related gains, net 25 — — — — — 25 Other revenues 40 48 16 27 32 (11) (8) Total segment revenues 9,126 8,429 7,818 7,517 611 301 697 Adjusted benefits and expenses Adjusted claims and other policy benefits 7,409 6,846 6,429 6,133 417 296 563 Future policy benefits remeasurement (gains) losses (66) (109) 74 262 (183) (188) 43 Adjusted interest credited 175 119 75 69 44 6 56 Policy acquisition costs and other insurance expenses 860 809 730 722 79 8 51 Other operating expenses 246 239 197 184 42 13 7 Total adjusted benefits and expenses 8,624 7,904 7,505 7,370 399 135 720 Adjusted operating income before income taxes $ 502 $ 525 $ 313 $ 147 $ 212 $ 166 (23) Key metrics Life reinsurance in force $1,893.4 billion $1,837.1 billion $1,703.6 billion $1,672.2 billion Future policy benefits remeasurement (gains) losses Effect of changes in cash flow assumptions $ (39) $ 53 $ 17 $ 170 Effect of actual variances from expected experience $ (27) $ (162) $ 57 $ 92 Loss ratio (1) 90 % 93 % 97 90 % Policy acquisition costs and other insurance expenses as a percentage of net premiums 11 % 10 % 11 % Other operating expenses as a percentage of net premiums 3 % 3 % 3 %
Read it in 10-K Feb 20, 2026 at sec.gov
RewordedMD&A
For the year ended December 31, 2025 2024 2023 2022 2025 vs 2024 vs 2023 2023 vs 2022 Segment revenues Net premiums $ 1,331 $ 1,291 $ 1,215 $ 1,219 $ 76 $ (4) 40 Net investment income 269 257 249 252 8 (3) 12 Investment related gains (losses), net 4 3 4 4 (1) — 1 Other revenues 1 6 4 4 2 — (5) Total segment revenues 1,605 1,557 1,472 1,479 85 (7) 48 Adjusted benefits and expenses Adjusted claims and other policy benefits 1,226 1,194 1,130 1,129 64 1 32 Future policy benefits remeasurement (gains) losses (5) (11) 22 (2) (33) 24 6 Adjusted interest credited 1 1 — — 1 Policy acquisition costs and other insurance expenses 171 186 184 203 2 (19) (15) Other operating expenses 55 53 44 41 9 3 2 Total adjusted benefits and expenses 1,448 1,423 1,381 1,371 42 10 25 Adjusted operating income before income taxes $ 157 $ 134 $ 91 $ 108 $ 43 $ (17) 23 Key metrics Life reinsurance in force $521.5 billion $474.2 billion $493.5 billion $463.6 billion Future policy benefits remeasurement (gains) losses Effect of changes in cash flow assumptions $ (9) $ (2) $ 13 $ 1 Effect of actual variances from expected experience $ 4 $ (9) $ 9 $ (3) Loss ratio (1) 92 % 95 % 93 92 % Policy acquisition costs and other insurance expenses as a percentage of net premiums 13 % 14 % 15 % 17 % Other operating expenses as a percentage of net premiums 4 % 4 % 3 %
Read it in 10-K Feb 20, 2026 at sec.gov
RewordedMD&A
For the year ended December 31, 2025 2024 2023 2022 2025 vs 2024 vs 2023 2023 vs 2022 Segment revenues Net premiums $ 774 $ 2,986 $ 1,521 $ 66 $ 1,465 $ 1,455 (2,212) Net investment income 1,745 1,280 1,137 1,063 143 74 465 Investment related gains (losses), net 28 — — — — — 28 Other revenues 658 226 221 263 5 (42) 432 Total segment revenues 3,205 4,492 2,879 1,392 1,613 1,487 (1,287) Adjusted benefits and expenses Adjusted claims and other policy benefits 1,496 3,187 1,646 205 1,541 1,441 (1,691) Future policy benefits remeasurement (gains) losses 3 1 (29) (28) 30 (1) 2 Adjusted interest credited 818 519 531 539 (12) (8) 299 Policy acquisition costs and other insurance expenses 421 374 214 170 160 44 47 Other operating expenses 100 85 66 58 19 8 15 Total adjusted benefits and expenses 2,838 4,166 2,428 944 1,738 1,484 (1,328) Adjusted operating income before income taxes $ 367 $ 326 $ 451 $ 448 $ (125) $ 3 41 Key metrics Future policy benefits remeasurement (gains) losses Effect of changes in cash flow assumptions $ — $ 7 $ (22) $ (4) Effect of actual variances from expected experience $ 3 $ (6) $ (7) $ (24)
Read it in 10-K Feb 20, 2026 at sec.gov
RewordedMD&A
For the year ended December 31, 2025 2024 2023 2022 2025 vs 2024 vs 2023 2023 vs 2022 Income (loss) before income taxes $ 1,540 $ 980 $ 1,160 $ 718 $ (180) $ 442 560 Investment and derivative (gains) losses 344 897 360 425 537 (65) (553) Market risk benefits remeasurement gains (losses) 8 (44) (10) 10 (34) (20) 52 Change in fair value of funds withheld embedded derivatives 14 (116) 163 173 (279) (10) 130 Funds withheld (gains) losses – investment income 15 3 (5) 24 8 (29) EIA embedded derivatives 12 Derivatives – interest credited 15 (6) (53) 21 47 15 — Investment income on unit-linked variable annuities — 3 1 24 2 (23) (3) Interest credited on unit-linked variable annuities — (3) (1) (24) (2) 23 3 Interest expense on uncertain tax positions 1 — — 1 — (1) Other 31 16 37 (80) (21) 117 15 Adjusted operating income before income taxes $ 1,967 $ 1,752 $ 1,699 $ 1,217 $ 53 $ 482 215
Read it in 10-K Feb 20, 2026 at sec.gov
RewordedMD&A
For the year ended December 31, 2025 2024 2023 2022 2025 vs 2024 vs 2023 2023 vs 2022 Segment revenues Net premiums $ — $ — $ — $ — $ — Net investment income 608 513 384 251 129 133 95 Investment related gains (losses), net 10 11 14 8 (3) 6 (1) Other revenues 81 63 43 34 20 9 18 Total segment revenues 699 587 441 293 146 148 112 Adjusted benefits and expenses Adjusted claims and other policy benefits — — — — — Future policy benefits remeasurement (gains) losses — — — — — Adjusted interest credited 186 150 61 32 89 29 36 Policy acquisition costs and other insurance expenses (66) (108) (91) (87) (17) (4) 42 Other operating expenses 431 413 342 319 71 23 18 Interest expense 366 303 257 191 46 66 63 Total adjusted benefits and expenses 917 758 569 455 189 114 159 Adjusted operating loss before income taxes $ (218) $ (171) $ (128) $ (162) $ (43) $ 34 (47)
Read it in 10-K Feb 20, 2026 at sec.gov
RewordedMD&A
The increase in adjusted operating income before income taxes in 2024 2025 was primarily due to favorable experience on in individual life business as compared to 2024, and organic growth, which was partially offset by unfavorable experience in group business in 2025 as compared to favorable experience group business in 2024 and lower future policy benefits remeasurement gains as compared to future policy benefits remeasurement losses in 2023. gains.
Read it in 10-K Feb 20, 2026 at sec.gov
RewordedMD&A
Net cash provided by operating activities $ 4,091 $ 9,370 $ 4,044 $ 1,343 Proceeds from long-term debt issuance, net 691 640 890 690 Treasury stock reissued 4 — — Change in cash collateral for derivative positions derivatives and other arrangements repurchase/reverse repurchase agreements 911 187 603 230 Change in deposit asset on reinsurance 181 268 227 — Net deposits from investment-type policies and contracts 7,454 2,850 — 4,340 Net change in noncontrolling interest Effect of exchange rate changes on cash 47 — — 90 Total sources 13,379 13,315 5,764 6,693 Uses:
Read it in 10-K Feb 20, 2026 at sec.gov
Quiet changesMD&A
The Company projects its reserves to be sufficient and it would does not expect to be required to take any actions to augment capital, even if interest rates remain at current levels for the next five years, assuming all other factors remain constant.
Read it in 10-K Feb 20, 2026 at sec.gov
Sources
The two latest 10-Ks on EDGAR, section by section. Each change links to the text at sec.gov.
Also
New risk factors: paragraphs with nothing like them last year, quoted in full.
Work with it
Excel workbook · CSV. Google Sheet that stays up to date: paste =IMPORTDATA("https://tickdelta.com/company/RGA/export.csv") into a cell.