Tyler Technologies TYL
Tyler Technologies, Inc. (“Tyler” or “Company”) is a leading provider of integrated software and technology management solutions for the public sector. 10-K, Item 1
- Employees
- 7,800
- Headquarters
- Plano, TX
- CEO
- H. Lynn Moore Jr
- Next results
- around Feb 10, 2027
Where each dollar of revenue went, FY2025
Revenue of $2.3B through the costs to a net profit of $315.6M · income statement of the 10-K
TYL among Technology peers
Six ratios from the latest 10-K. Each corner is the share of 74 peers the company is above, not a score.
What changed
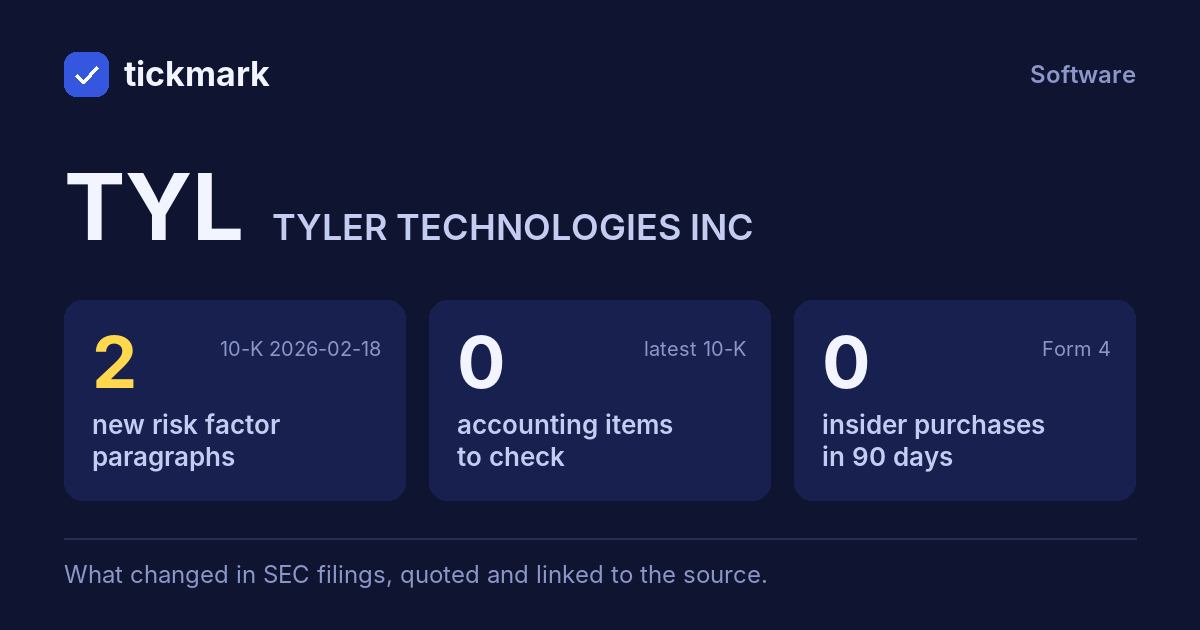
2 new risk paragraphs. 10-K filed Feb 18, 2026 against Feb 19, 2025.
Each row opens the detail with the quote and the filing. A row is a change worth reading, not a verdict.
Accounting checks
9 checks on the latest 10-K. Checks, not verdicts.
0facts worth reading about all 9 checks found nothing to note
-
Receivables +8.7% vs revenue +9.1% (-0.4 pts)
-
Cash from operations $653.5M vs net income $315.6M (FY ending Dec 31, 2025)
-
Same auditor in both 10-Ks: Ernst & Young LLP
6 more checks with nothing to note
-
No statement of substantial doubt about going concern
-
No 8-K item 4.02 in the last 2 years
-
No NT 10-K or NT 10-Q in the last 2 years
-
No sentence in the 10-K concludes that controls were not effective because of a material weakness
-
No 8-K item 2.06 in the last 2 years
-
No 8-K item 1.03 in the last 2 years
In their words
2 paragraphs in Risk Factors that were not in the 10-K filed Feb 19, 2025. Quoted as filed.
-
Item 1A · new paragraph · not in the 10-K filed Feb 19, 2025 10-K, ITEM 1A
We must timely adapt to and implement technological changes to be remain competitive.
New risk paragraphs, against peers
Latest 10-K of each, Technology companies closest in revenue
Paragraphs in Risk Factors with nothing like them in the company's 10-K the year before. A count of text, not of risk.
Financial performance
Last 4 fiscal years · 10-K XBRL
| Metric | FY2022 | FY2023 | FY2024 | FY2025 |
|---|---|---|---|---|
| Revenue | $1.9B | $2.0B | $2.1B | $2.3B |
| Net income | $164.2M | $165.9M | $263.0M | $315.6M |
| Operating cash flow | $381.5M | $380.4M | $624.6M | $653.5M |
| Free cash flow | $358.9M | $359.9M | $604.1M | $637.5M |
Revenue, FY2016 to FY2025
Ten fiscal years, each from its own 10-K · XBRL · USD
$2.3B ▲ 9.1% in FY2025$315.6M ▲ 20.0% in FY2025$637.5M ▲ 5.5% in FY2025
Recent filings
2 filings in the last 30 days · SEC EDGAR
-
8-KOct 28, 2026Quarterly results 8-K item 2.02
-
10-QOct 28, 2026Quarterly report (10-Q) period ended Sep 30, 2026
About the company
Tyler Technologies, Plano, TX · from the 10-K filed Feb 18, 2026
Tyler Technologies, Inc. (“Tyler” or “Company”) is a leading provider of integrated software and technology management solutions for the public sector. Our solutions empower local, state, and federal government entities to create smarter, safer, and stronger communities. We offer the broadest range of software solutions and services designed for every level of public sector government agency. Our solutions deliver mission-critical technology to support the essential functions of government, including public safety, justice, public health, taxation and budgeting, infrastructure and land use, outdoor recreation, utility and civic services, regulation, K-12 education, and social services.
- Headquarters
- Plano, TX
- Country
- United States
- Reports in
- USD
- Listed on
- NYSE
- Fiscal year ends
- December 31
- Last results
- Oct 28, 2026
- Incorporated in
- DE
Employees, at the top of the page: "As of December 31, 2025, we had approximately 7,800 team members" (10-K). Address and exchange: SEC's company file.
Email alerts
Sources
The 10-K filed Feb 18, 2026 (open at SEC), compared with the 10-K filed Feb 19, 2025. Numbers from the XBRL of the 10-Ks; filings from SEC EDGAR.
Work with it: Excel workbook · CSV. Google Sheet that stays up to date: paste =IMPORTDATA("https://tickdelta.com/company/TYL/export.csv") into a cell.