Form 10-K
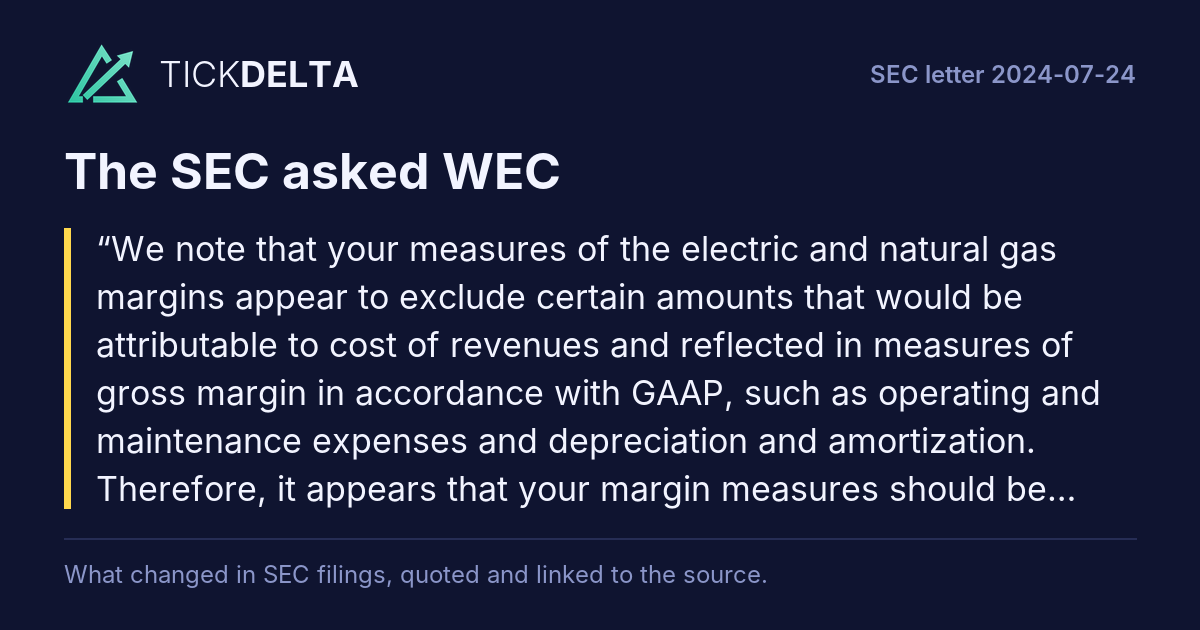
We note that your measures of the electric and natural gas margins appear to exclude certain amounts that would be attributable to cost of revenues and reflected in measures of gross margin in accordance with GAAP, such as operating and maintenance expenses and depreciation and amortization.Rest of the question
Therefore, it appears that your margin measures should be clearly identified as non-GAAP measures and that you would need to adhere to the disclosure requirements in Item 10(e) of Regulation S-K. For example, electric gross margin and natural gas gross margin, each reflecting all costs and expenses applicable to revenues, would be identified as the most directly comparable GAAP measures in providing the disclosures required by Item 10(e)(1)(i)(A) and (B) of Regulation S-K; reconciliations to your non-GAAP measures should begin with these GAAP measures. 1. In your revised disclosure, please also include analyses of the changes in these most directly comparable GAAP measures, similar to those provided for changes in your non- GAAP measures of the electric and gas margins. Please refer to Question 100.05 and 102.10(a) and (b) of the Division's Non-GAAP Financial Measures Compliance and Disclosure Interpretations. Please provide a response that clearly explains how you intend to revise your non-GAAP and MD&A disclosures. Please note this comment also applies to the disclosures of your utility subsidiaries.
The Company respectfully acknowledges the Staff’s comment and view that our presentation of electric margin and natural gas margin are non-GAAP measures as they exclude certain costs and expenses applicable to revenues, and that the most directly comparable GAAP measure is electric gross margin and natural gas gross margin that reflect all costs and expenses applicable to revenues. In response, the Company will no longer present non-GAAP electric margin and non-GAAP natural gas margin.Read in the reply ↗Rest of the answer
Instead, the Company will present a combined non-GAAP utility margin for each of its three utility segments and will provide a reconciliation of GAAP gross margin to non-GAAP utility margin for these segments in future filings.
The Company has provided an illustrative example of the disclosure and reconciliation below, as if included in the Company’s Form 10-K for the fiscal year ended December 31, 2023. The Company plans to incorporate similar disclosures in future filings beginning with its Quarterly Report on Form 10-Q for the quarter ending September 30, 2024. In addition, the Company’s utility subsidiaries, Wisconsin Electric Power Company and Wisconsin Public Service Corporation, will provide substantially the same disclosure in future filings beginning with their Quarterly Reports on Form 10-Q for the quarter ending September 30, 2024.
The Company proposes including the following updated disclosures within "Results of Operations."
Non-GAAP Financial Measures
The discussions below address the contribution of each of our utility segments to net income attributed to common shareholders. The discussions include financial information prepared in accordance with GAAP, as well as utility margin, which is not a measure of financial performance under GAAP. Utility margin (operating revenues less fuel and purchased power costs and cost of natural gas sold) is a non-GAAP financial measure because it excludes certain operation and maintenance expenses applicable to revenues, as well as depreciation and amortization and property and revenue taxes.
We believe that utility margin provides a useful basis for evaluating utility operations since the majority of prudently incurred fuel and purchased power costs, as well as prudently incurred natural gas costs, are passed through to customers in current rates. As a result, management uses utility margin internally when assessing the operating performance of our utility segments as these measures exclude the majority of revenue fluctuations caused by changes in these expenses. Similarly, the presentation of utility margin herein is intended to provide supplemental information for investors regarding our operating performance.
Our utility margin may not be comparable to similar measures presented by other companies. Furthermore, this measure is not intended to replace gross margin as determined in accordance with GAAP as an indicator of operating performance. Each of our three utility segment discussions below include a table that provides the calculation of both gross margin as determined in accordance with GAAP and utility margin, as well as a reconciliation between the two measures.
Wisconsin Segment Contribution to Net Income Attributed to Common Shareholders
Year Ended December 31
(in millions) 2023 2022 B (W)
Operating revenues $ 6,625.9 $ 6,960.5 $ (334.6)
Operating expenses
Cost of sales (1)
2,510.6 3,208.8 698.2
Other operation and maintenance 1,531.3 1,351.3 (180.0)
Depreciation and amortization 851.5 754.7 (96.8)
Property and revenue taxes 179.2 182.6 3.4
Operating income 1,553.3 1,463.1 90.2
Other income, net 137.6 99.9 37.7
Interest expense 601.0 555.9 (45.1)
Income before income taxes 1,089.9 1,007.1 82.8
Income tax expense 237.4 247.5 10.1
Preferred stock dividends of subsidiary 1.2 1.2 —
Net income attributed to common shareholders $ 851.3 $ 758.4 $ 92.9
(1) Cost of sales includes fuel and purchased power and cost of natural gas sold.
Gross Margin GAAP and Utility Margin Non-GAAP
The following table summarizes our Wisconsin segment gross margin (GAAP) and reconciles gross margin (GAAP) to utility margin (non-GAAP). See "Non-GAAP Financial Measures" above for additional information regarding gross margin (GAAP) and utility margin (non-GAAP).
Electric revenues $ 5,010.8 $ 4,971.8 $ 39.0
Natural gas revenues 1,615.1 1,988.7 (373.6)
Operating revenues 6,625.9 6,960.5 (334.6)
Fuel and purchased power (1,615.9) (1,881.4) 265.5
Cost of natural gas sold (894.7) (1,327.4) 432.7
Other operation and maintenance (1)
(1,133.8) (978.2) (155.6)
Depreciation and amortization (851.5) (754.7) (96.8)
Property and revenue taxes (179.2) (182.6) 3.4
Gross margin (GAAP) 1,950.8 1,836.2 114.6
1,133.8 978.2 155.6
Depreciation and amortization 851.5 754.7 96.8
Property and revenue taxes 179.2 182.6 (3.4)
Utility margin (non-GAAP) $ 4,115.3 $ 3,751.7 $ 363.6
(1) Operating and maintenance expenses deemed to be directly attributable to our revenue-producing activities include plant operating and maintenance expenses related to our generating units; costs associated with the We Power generating units; and transmission, distribution and customer service expenses. These expenses are included in the above table to calculate gross margin as defined under GAAP.
Gross margin (GAAP) increased $114.6 million during 2023, compared to 2022 and utility margin (non-GAAP) increased $363.6 million during 2023, compared to 2022. Both measures were driven by:
•A $447.1 million increase in margins related to the impact of the Wisconsin rate orders approved by the PSCW, effective January 1, 2023.
•A $61.6 million year-over-year positive impact from collections of fuel and purchased power costs. Under the Wisconsin fuel rules, the margins of our electric utilities are impacted by underor over-collections of certain fuel and purchased power costs that are within a 2% price variance from the costs included in rates, and the remaining variance beyond the 2% price variance is generally deferred for future recovery or refund to customers. In 2022, WPS was unable to defer a portion of its under-collected fuel and purchased power costs due to earning an ROE in excess of the PSCW authorized amount.
•A $15.7 million increase in margins during 2023, related to the expiration of a capacity purchase contract driven by the acquisition of the Whitewater facility, effective January 1, 2023.
These increases in margins were partially offset by:
•A $125.3 million decrease in margins related to lower retail sales volumes, driven by the impact of unfavorable weather during 2023, compared with 2022. As measured by cooling degree days, 2023 was 7.2% and 17.0% cooler than 2022 in the Milwaukee area and Green Bay area, respectively. As measured by heating degree days, 2023 was 15.1% and 11.4% warmer than 2022 in the Milwaukee area and Green Bay area, respectively.
•A $25.1 million decrease in other revenues, primarily related to a FERC order in January 2023 that eliminated reactive power compensation MISO was required to pay to generators, including our electric utilities, as well as lower revenues from third-party use of our assets. The decrease in reactive power revenues is substantially offset by a decrease in transmission expense related to a deferral of these revenues as a component of our transmission escrow, as approved by the PSCW in June 2023 and discussed below.
•Lower margins of $8.0 million driven by the expiration of a wholesale contract in May 2022.
Additionally, the smaller increase in gross margin (GAAP) as compared to the increase in utility margin (non-GAAP), was driven by the following items:
•A $109.5 million increase in transmission expense;
•A $96.8 million increase in depreciation and amortization;
•A $33.3 million increase in other operation and maintenance expense related to the We Power leases; and
•A $29.4 million increase in other operation and maintenance related to our power plants; partially offset by
•A $15.6 million decrease in electric and natural gas distribution expenses.
Illinois Segment Contribution to Net Income Attributed to Common Shareholders
Operating revenues $ 1,557.8 $ 1,890.9 $ (333.1)
Cost of natural gas sold 443.0 792.5 349.5
Other operation and maintenance 397.9 459.2 61.3
Impairment related to ICC disallowances 178.9 — (178.9)
Depreciation and amortization 237.3 230.9 (6.4)
Property and revenue taxes 29.9 38.6 8.7
Operating income 270.8 369.7 (98.9)
Other income, net 6.7 14.1 (7.4)
Interest expense 88.9 73.8 (15.1)
Income before income taxes 188.6 310.0 (121.4)
Income tax expense 48.6 83.1 34.5
Net income attributed to common shareholders $ 140.0 $ 226.9 $ (86.9)
The following table summarizes our Illinois segment gross margin (GAAP) and reconciles gross margin (GAAP) to utility margin (non-GAAP). See "Non-GAAP Financial Measures" above for additional information regarding gross margin (GAAP) and utility margin (non-GAAP).
Cost of natural gas sold (443.0) (792.5) 349.5
(206.2) (255.8) 49.6
Depreciation and amortization (237.3) (230.9) (6.4)
Property and revenue taxes (29.9) (38.6) 8.7
Gross margin (GAAP) 641.4 573.1 68.3
206.2 255.8 (49.6)
Depreciation and amortization 237.3 230.9 6.4
Property and revenue taxes 29.9 38.6 (8.7)
Utility margin (non-GAAP) $ 1,114.8 $ 1,098.4 $ 16.4
(1) Operating and maintenance expenses deemed to be directly attributable to our revenue-producing activities include distribution and customer service expenses. These expenses are included in the above table to calculate gross margin as defined under GAAP.
Gross margin (GAAP) increased $68.3 million during 2023, compared to 2022 and utility margin (non-GAAP) increased $16.4 million during 2023, compared to 2022. Both measures were driven by:
•A $29.5 million increase in margins related to the impact of the PGL rate order issued by the ICC, effective December 1, 2023; and
•A $23.9 million increase in revenues at PGL due to continued capital investment in the SMP project under the QIP rider. PGL recovered the costs related to the SMP through a surcharge on customer bills pursuant to the QIP rider, which was in effect for most of 2023; partially offset by
•A $32.9 million decrease in margins associated with certain riders that are offset in other operation and maintenance and therefore do not have a significant impact on net income.
For information on PGL's rate order, the QIP rider, PGL's plan to recover SMP costs after 2023, and the pause in spending on the SMP, see Note 26, Regulatory Environment.
Additionally, the larger increase in gross margin (GAAP) as compared to the increase in utility margin (non-GAAP), was driven by the following items:
•A $43.8 million decrease in natural gas distribution and maintenance costs;
•An $8.7 million decrease in property and revenue taxes; and
•A $3.7 million decrease in customer service expense due to lower call center expense and metering costs; partially offset by
•A $6.4 million increase in depreciation and amortization.
Other States Segment Contribution to Net Income Attributed to Common Shareholders
Operating revenues $ 519.1 $ 618.5 $ (99.4)
Cost of natural gas sold 277.2 391.6 114.4
Other operation and maintenance 94.5 98.5 4.0
Depreciation and amortization 43.3 40.9 (2.4)
Property and revenue taxes 24.4 23.3 (1.1)
Operating income 79.7 64.2 15.5
Other income, net 0.6 2.5 (1.9)
Interest expense 15.9 13.9 (2.0)
Income before income taxes 64.4 52.8 11.6
Income tax expense 16.3 13.1 (3.2)
Net income attributed to common shareholders $ 48.1 $ 39.7 $ 8.4
The following table summarizes our other states segment gross margin (GAAP) and reconciles gross margin (GAAP) to utility margin (non-GAAP). See "Non-GAAP Financial Measures" above for additional information regarding gross margin (GAAP) and utility margin (non-GAAP).
Cost of natural gas sold (277.2) (391.6) 114.4
(54.2) (55.9) 1.7
Depreciation and amortization (43.3) (40.9) (2.4)
Property and revenue taxes (24.4) (23.3) (1.1)
Gross margin (GAAP) 120.0 106.8 13.2
54.2 55.9 (1.7)
Depreciation and amortization 43.3 40.9 2.4
Property and revenue taxes 24.4 23.3 1.1
Utility margin (non-GAAP) $ 241.9 $ 226.9 $ 15.0
(1) Operating and maintenance expenses deemed to be directly attributable to our revenue-producing activities include distribution and customer service expenses. These expenses are included in the above table to calculate gross margin as defined under GAAP.
Gross margin (GAAP) increased $13.2 million during 2023, compared to 2022 and utility margin (non-GAAP) increased $15.0 million during 2023, compared to 2022. Both measures were driven by:
A $19.5 million positive impact related to an interim rate increase at MERC that was effective January 1, 2023. See Note 26, Regulatory Environment, for more information. This increase was partially offset by a $6.1 million decrease related to lower sales volumes, primarily driven by warmer weather. As measured by heating degree days, 2023 was 14.7% and 13.1% warmer than 2022 at MERC and MGU, respectively.
Additionally, the smaller increase in gross margin (GAAP) as compared to the increase in utility margin (non-GAAP), was driven by the following items:
•A $2.4 million increase in depreciation and amortization; partially offset by
•A $1.8 million decrease in natural gas operations and customer service expense.
First report after the company's reply of 2024-08-20: 10-Q filed 2024-11-01 ↗, against the 10-Q filed 2024-05-03 ↗.
Tickdelta does not hold the text of both reports, so they are not compared here.
Also in this review: closing letter, 2024-08-26