SEI Investments Co SEIC
- Headquarters
- Oaks, PA
- CEO
- Ryan Hicke
- Next results
- around Jan 27, 2027
Where each dollar of revenue went, FY2025
Revenue of $2.3B through the costs to a net profit of $715.3M · income statement of the 10-K
SEIC among Financials peers
Six ratios from the latest 10-K. Each corner is the share of 241 peers the company is above, not a score.
What changed
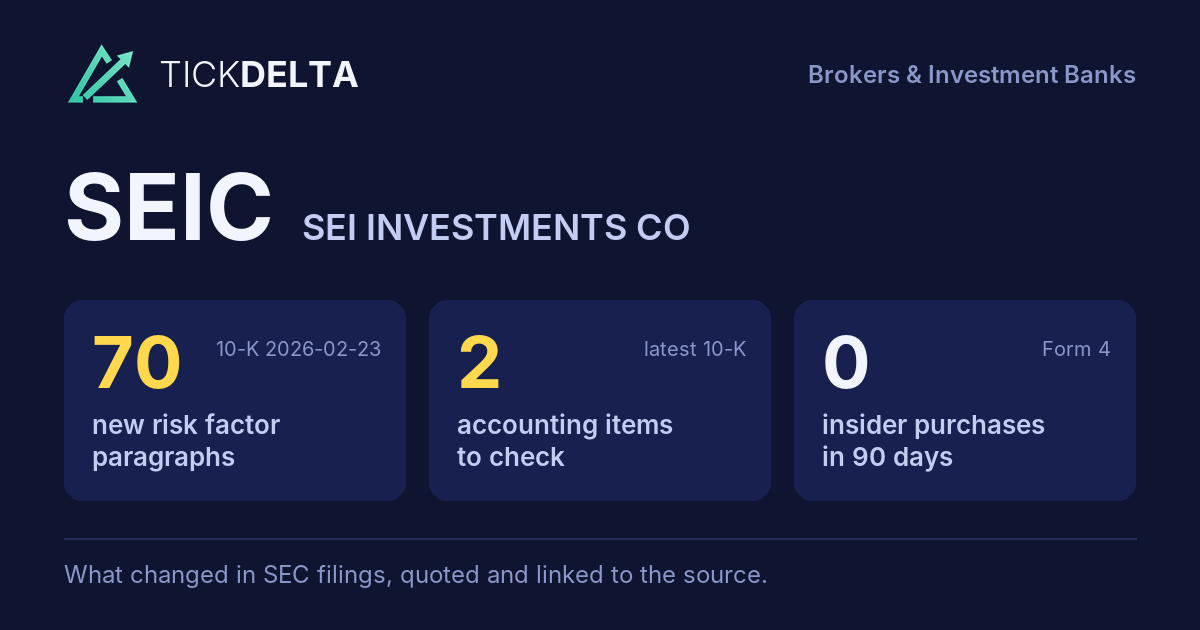
70 new risk paragraphs and 2 accounting facts worth reading about. 10-K filed Feb 23, 2026 against Feb 20, 2025.
Each row opens the detail with the quote and the filing. A row is a change worth reading, not a verdict.
Accounting checks
9 checks on the latest 10-K. Checks, not verdicts.
2facts worth reading about the other 7 checks found nothing to note
-
Receivables growing faster than revenueReceivables +25.0% ($567.6M to $709.7M) vs revenue +8.1% ($2.1B to $2.3B), +16.9 pts apart
-
Critical audit matters changedNew this year: Evaluation of the fair value of acquired client relationships (“As discussed in Note 14 to the consolidated financial statements, the Company, through its wholly-owned indirect subsidiary SEI-Eclipse Holding Company, LLC, closed the first stage of a transaction acquiring all of the outstanding equity of Stratos US Holdings (Stratos) on December 3, 2025 for a com”). Same as last year: Recoverability of SEI Wealth PlatformSM (SWP) Capitalized Software Development Costs
-
Same auditor in both 10-Ks: KPMG LLP
6 more checks with nothing to note
-
No statement of substantial doubt about going concern
-
No 8-K item 4.02 in the last 2 years
-
No NT 10-K or NT 10-Q in the last 2 years
-
No sentence in the 10-K concludes that controls were not effective because of a material weakness
-
No 8-K item 2.06 in the last 2 years
-
No 8-K item 1.03 in the last 2 years
In their words
70 paragraphs in Risk Factors that were not in the 10-K filed Feb 20, 2025. Quoted as filed.
-
Item 1A · new paragraph · not in the 10-K filed Feb 20, 2025 10-K, ITEM 1A
Client relationships are also affected by external factors such as market volatility, regulatory changes, and industry consolidation. In addition, our ability to retain and grow client relationships depends on our capacity to innovate and deliver new products and services that meet evolving client needs, including ESG solutions,…
-
Item 1A · new paragraph · not in the 10-K filed Feb 20, 2025 10-K, ITEM 1A
M&A Execution and Integration Risks. Our ability to derive value from mergers, acquisitions, and strategic partnerships is uncertain, especially when integrating large or cross-border transactions. If we cannot smoothly combine acquired businesses into our operations, we may fail to realize expected benefits, and our financial results…
-
Item 1A · new paragraph · not in the 10-K filed Feb 20, 2025 10-K, ITEM 1A
Additionally, we rely on investment sub-advisers to manage significant portions of assets within our programs. Failures in oversight or misconduct by these firms, including regulatory noncompliance or fraud, could result in financial loss, sanctions, or reputational damage. Transitioning assets between sub-advisers or insourcing these…
-
Item 1A · new paragraph · not in the 10-K filed Feb 20, 2025 10-K, ITEM 1A
Operational Resilience (Business Continuity and Disaster Recovery). Our ability to deliver products and services depends on the uninterrupted functioning of our systems and those of other participants in the global financial system. These operations are highly interconnected, and many transactions involving our products rely on multiple…
New risk paragraphs, against peers
Latest 10-K of each, Financials companies closest in revenue
Paragraphs in Risk Factors with nothing like them in the company's 10-K the year before. A count of text, not of risk.
Financial performance
Last 4 fiscal years · 10-K XBRL
| Metric | FY2022 | FY2023 | FY2024 | FY2025 |
|---|---|---|---|---|
| Revenue | $2.0B | $1.9B | $2.1B | $2.3B |
| Net income | $475.5M | $462.3M | $581.2M | $715.3M |
| Operating cash flow | $566.1M | $447.0M | $622.3M | $607.7M |
| Free cash flow | $526.9M | $422.2M | $590.1M | $585.0M |
Revenue, FY2016 to FY2025
Ten fiscal years, each from its own 10-K · XBRL · USD
$2.3B ▲ 8.1% in FY2025$715.3M ▲ 23.1% in FY2025$585.0M ▼ 0.9% in FY2025
Recent filings
3 filings in the last 30 days · SEC EDGAR
-
Planned saleNov 10, 2026William Doran (Director) gave notice of a planned sale of 8,000 shares worth about $885K Form 144, approximate sale date Nov 10, 2026
-
10-QOct 26, 2026Quarterly report (10-Q) period ended Sep 30, 2026
-
8-KOct 21, 2026Quarterly results, Regulation FD disclosure, Other events 8-K items 2.02, 7.01, 8.01
About the company
SEI Investments Co, Oaks, PA · from the 10-K filed Feb 23, 2026
SEI Investments Company (together, with its subsidiaries unless otherwise noted, “SEI” or the “Company”) is a leading global provider of financial technology, operations, and asset management solutions that connect the financial services ecosystem across advice, asset management, and administration. Our enterprise operating model unifies technology, trust‑based custody, and investment management to help clients more effectively deploy their capital, whether that’s money, time, or talent, so they can better serve their clients and achieve their growth objectives.
- Headquarters
- Oaks, PA
- Country
- United States
- Reports in
- USD
- Listed on
- Nasdaq
- Fiscal year ends
- December 31
- Last results
- Oct 21, 2026
- Incorporated in
- PA
Email alerts
Sources
The 10-K filed Feb 23, 2026 (open at SEC), compared with the 10-K filed Feb 20, 2025. Numbers from the XBRL of the 10-Ks; filings from SEC EDGAR.
Work with it: Excel workbook · CSV. Google Sheet that stays up to date: paste =IMPORTDATA("https://tickdelta.com/company/SEIC/export.csv") into a cell.