FTI Consulting, Inc FCN
Unless otherwise indicated or required by the context, when we use the terms “Company,” “FTI Consulting,” “we,” “us” and “our,” we mean FTI Consulting, Inc., a Maryland corporation, and its consolidated subsidiaries. 10-K, Item 1
- Employees
- 8,118
- Headquarters
- Washington, DC
- Next results
- around Feb 26, 2027
Where each dollar of revenue went, FY2025
Revenue of $3.8B through the costs to a net profit of $270.9M · income statement of the 10-K
FCN among Industrials peers
Six ratios from the latest 10-K. Each corner is the share of 251 peers the company is above, not a score.
What changed
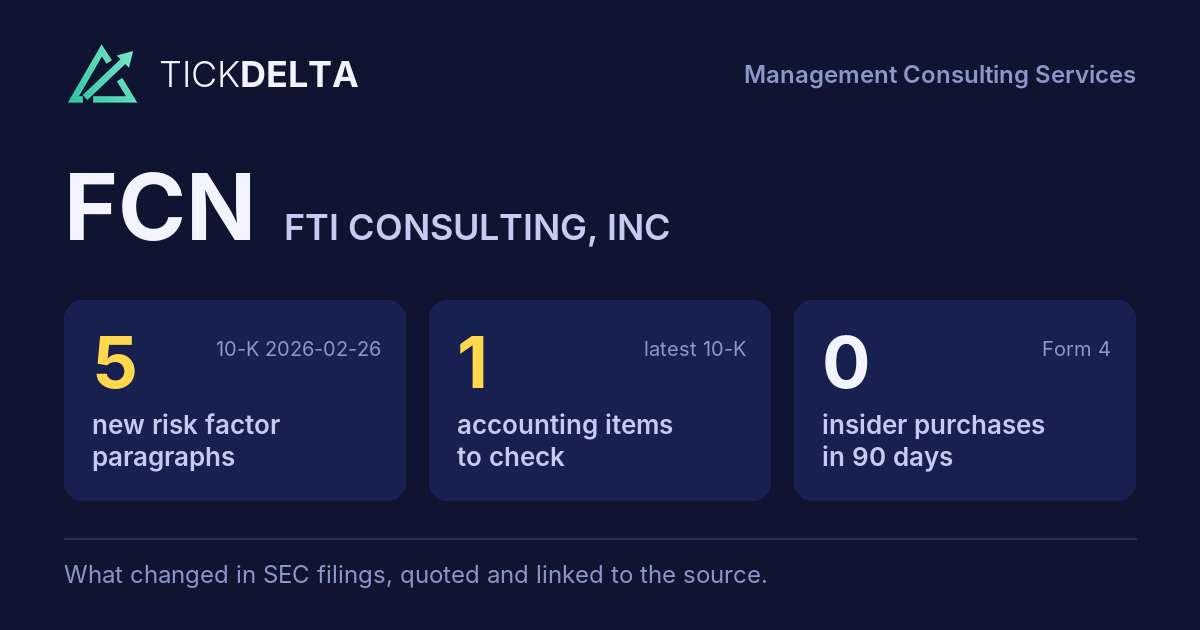
5 new risk paragraphs and 1 accounting fact worth reading about. 10-K filed Feb 26, 2026 against Feb 20, 2025.
Each row opens the detail with the quote and the filing. A row is a change worth reading, not a verdict.
Accounting checks
10 checks on the latest 10-K. Checks, not verdicts.
1fact worth reading about the other 9 checks found nothing to note
-
Cash from operations lower than net incomeCash from operations $152.1M vs net income $270.9M (FY ending Dec 31, 2025)
-
Receivables +1.7% ($1.0B to $1.0B) vs revenue +2.4% ($3.7B to $3.8B), -0.7 pts apart
8 more checks with nothing to note
-
Same auditor in both 10-Ks: KPMG LLP
-
No statement of substantial doubt about going concern
-
No 8-K item 4.02 in the last 2 years
-
No NT 10-K or NT 10-Q in the last 2 years
-
The same matters as last year: Changes in estimates of potential fee reductions
-
No sentence in the 10-K concludes that controls were not effective because of a material weakness
-
No 8-K item 2.06 in the last 2 years
-
No 8-K item 1.03 in the last 2 years
In their words
5 paragraphs in Risk Factors that were not in the 10-K filed Feb 20, 2025. Quoted as filed.
-
Item 1A · new paragraph · not in the 10-K filed Feb 20, 2025 10-K, ITEM 1A
In connection with our acquisitions, we generally obtain non-solicitation agreements from the professionals we hire, as well as non-competition agreements from senior managers and professionals. The agreements prohibit such individuals from
New risk paragraphs, against peers
Latest 10-K of each, Industrials companies closest in revenue
Paragraphs in Risk Factors with nothing like them in the company's 10-K the year before. A count of text, not of risk.
Financial performance
Last 4 fiscal years · 10-K XBRL
| Metric | FY2022 | FY2023 | FY2024 | FY2025 |
|---|---|---|---|---|
| Revenue | $3.0B | $3.5B | $3.7B | $3.8B |
| Net income | $235.5M | $274.9M | $280.1M | $270.9M |
| Operating cash flow | $188.8M | $224.5M | $395.1M | $152.1M |
| Free cash flow | $135.5M | $175.0M | $359.7M | $93.6M |
Revenue, FY2016 to FY2025
Ten fiscal years, each from its own 10-K · XBRL · USD
$3.8B ▲ 2.4% in FY2025$270.9M ▼ 3.3% in FY2025$93.6M ▼ 74.0% in FY2025
Recent filings
4 filings in the last 30 days · SEC EDGAR
-
Planned saleNov 4, 2026PAUL LINTON (Officer) gave notice of a planned sale of 2,000 shares worth about $398K Form 144, approximate sale date Nov 4, 2026
-
Planned saleNov 3, 2026PAUL LINTON (Officer) gave notice of a planned sale of 4,378 shares worth about $832K Form 144, approximate sale date Nov 3, 2026
-
8-KOct 30, 2026Quarterly results, Restructuring or exit costs, Regulation FD disclosure 8-K items 2.02, 2.05, 7.01
-
10-QOct 29, 2026Quarterly report (10-Q) period ended Sep 30, 2026
About the company
FTI Consulting, Inc, Washington, DC · from the 10-K filed Feb 26, 2026
Unless otherwise indicated or required by the context, when we use the terms “Company,” “FTI Consulting,” “we,” “us” and “our,” we mean FTI Consulting, Inc., a Maryland corporation, and its consolidated subsidiaries. FTI Consulting is a leading global expert firm for organizations facing crisis and transformation. Individually, each of our segments and practices is staffed with experts recognized for the depth of their knowledge and a track record of making an impact.
- Headquarters
- Washington, DC
- Country
- United States
- Reports in
- USD
- Listed on
- NYSE
- Fiscal year ends
- December 31
- Last results
- Oct 30, 2026
- Incorporated in
- MD
Employees, at the top of the page: "As of December 31, 2025, we employed 8,118 employees, of which 6,421 were billable professionals" (10-K). Address and exchange: SEC's company file.
Email alerts
Sources
The 10-K filed Feb 26, 2026 (open at SEC), compared with the 10-K filed Feb 20, 2025. Numbers from the XBRL of the 10-Ks; filings from SEC EDGAR.
Work with it: Excel workbook · CSV. Google Sheet that stays up to date: paste =IMPORTDATA("https://tickdelta.com/company/FCN/export.csv") into a cell.