Forrester Research, Inc. FORR
Forrester Research, Inc. is a global independent research and advisory firm. 10-K, Item 1
- Headquarters
- Cambridge, MA
- Next results
- around Feb 11, 2027
Where each dollar of revenue went, FY2023
Revenue of $480.8M through the costs to a net profit of $3.0M · income statement of the 10-K
FORR among Industrials peers
Six ratios from the latest 10-K. Each corner is the share of 251 peers the company is above, not a score.
What changed
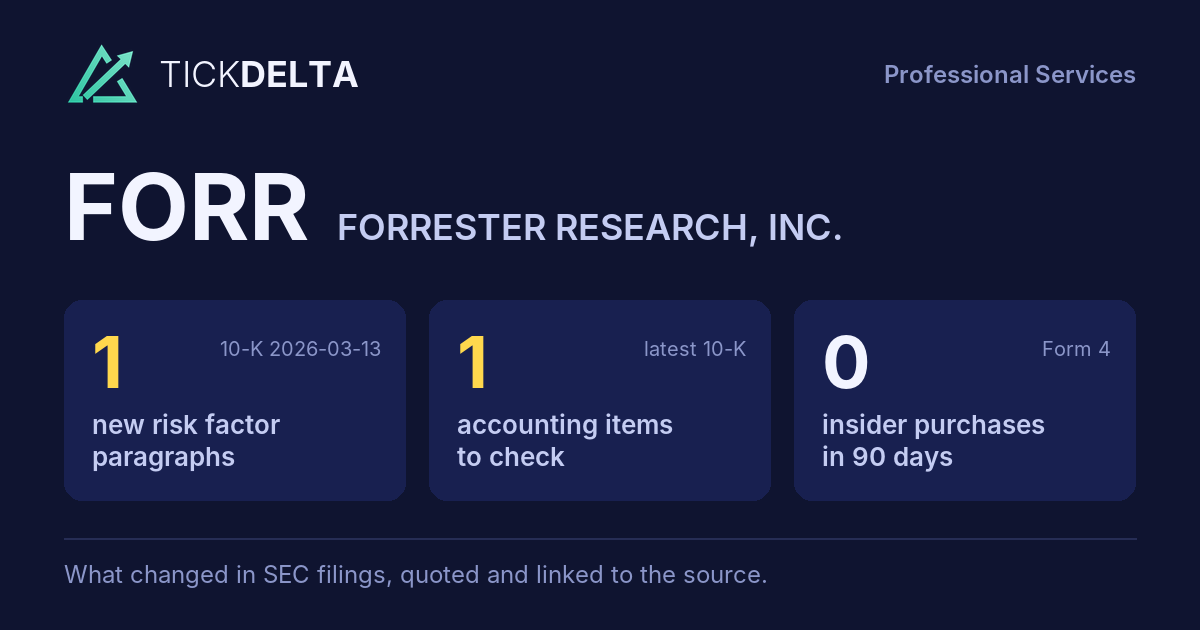
1 new risk paragraph and 1 accounting fact worth reading about. 10-K filed Mar 13, 2026 against Mar 7, 2025.
Each row opens the detail with the quote and the filing. A row is a change worth reading, not a verdict.
Accounting checks
10 checks on the latest 10-K. Checks, not verdicts.
1fact worth reading about the other 9 checks found nothing to note
-
Critical audit matters changedNew this year: Interim and Annual Goodwill Impairment Assessments - Research Reporting Unit (“As described in Notes 1 and 4 to the consolidated financial statements, the Company’s goodwill balance was $120.4 million as of December 31, 2025, and the goodwill associated with the Research reporting unit was $112.1 million. Goodwill is tested by management for impairment at the reporting unit le”). Same as last year: Revenue Recognition - Identification of Performance Obligations
-
Receivables -8.4% ($55.5M to $50.9M) vs revenue -8.2% ($432.5M to $396.9M), -0.1 pts apart
8 more checks with nothing to note
-
Cash from operations $21.1M vs net income −$119.4M (FY ending Dec 31, 2025)
-
Same auditor in both 10-Ks: PricewaterhouseCoopers LLP
-
No statement of substantial doubt about going concern
-
No 8-K item 4.02 in the last 2 years
-
No NT 10-K or NT 10-Q in the last 2 years
-
No sentence in the 10-K concludes that controls were not effective because of a material weakness
-
No 8-K item 2.06 in the last 2 years
-
No 8-K item 1.03 in the last 2 years
In their words
1 paragraph in Risk Factors that was not in the 10-K filed Mar 7, 2025. Quoted as filed.
-
Item 1A · new paragraph · not in the 10-K filed Mar 7, 2025 10-K, ITEM 1A
We have recently recorded substantial impairment charges. Any future impairments of our assets could negatively impact our results of operations. We test goodwill for impairment annually or whenever events or changes in circumstances indicate that the carrying value may not be recoverable. An impairment test is also required for other…
New risk paragraphs, against peers
Latest 10-K of each, Industrials companies closest in revenue
Paragraphs in Risk Factors with nothing like them in the company's 10-K the year before. A count of text, not of risk.
Financial performance
Last 4 fiscal years · 10-K XBRL
| Metric | FY2022 | FY2023 | FY2024 | FY2025 |
|---|---|---|---|---|
| Revenue | $537.8M | $480.8M | $432.5M | $396.9M |
| Net income | $21.8M | $3.0M | −$5.7M | −$119.4M |
| Operating cash flow | $39.4M | $21.7M | −$3.9M | $21.1M |
| Free cash flow | $33.8M | $16.2M | −$7.3M | $18.1M |
Revenue, FY2016 to FY2025
Ten fiscal years, each from its own 10-K · XBRL · USD
$396.9M ▼ 8.2% in FY2025−$119.4M in FY2025$18.1M in FY2025
Recent filings
3 filings in the last 30 days · SEC EDGAR
-
SEC letterNov 14, 2026SEC asked 3 questions about Schedule TO-I letters Apr 9, 2013 to Apr 10, 2013 · no closing letter yet
-
10-QNov 6, 2026Quarterly report (10-Q) period ended Sep 30, 2026
-
8-KOct 29, 2026Quarterly results 8-K item 2.02
About the company
Forrester Research, Inc., Cambridge, MA · from the 10-K filed Mar 13, 2026
Forrester Research, Inc. is a global independent research and advisory firm. We empower leaders in technology, customer experience, digital, marketing, sales, and product functions to accelerate growth through customer obsession. Forrester’s unique research and continuance guidance model helps executives and their teams achieve their initiatives and outcomes faster and with confidence. Our common stock is listed on Nasdaq Global Select Market under the symbol "FORR".
- Headquarters
- Cambridge, MA
- Country
- United States
- Reports in
- USD
- Listed on
- Nasdaq
- Fiscal year ends
- December 31
- Last results
- Oct 29, 2026
- Incorporated in
- DE
Email alerts
Sources
The 10-K filed Mar 13, 2026 (open at SEC), compared with the 10-K filed Mar 7, 2025. Numbers from the XBRL of the 10-Ks; filings from SEC EDGAR.
Work with it: Excel workbook · CSV. Google Sheet that stays up to date: paste =IMPORTDATA("https://tickdelta.com/company/FORR/export.csv") into a cell.