Celestica Inc CLS
We were incorporated in Ontario, Canada on September 27, 1996. 10-K, Item 1
- Headquarters
- Toronto, A6
- CEO
- Robert Mionis
- Next results
- around Jan 27, 2027
Where each dollar of revenue went, FY2025
Revenue of $12.4B through the costs to a net profit of $832.5M · income statement of the 10-K
CLS among Technology peers
Six ratios from the latest 10-K. Each corner is the share of 230 peers the company is above, not a score.
What changed
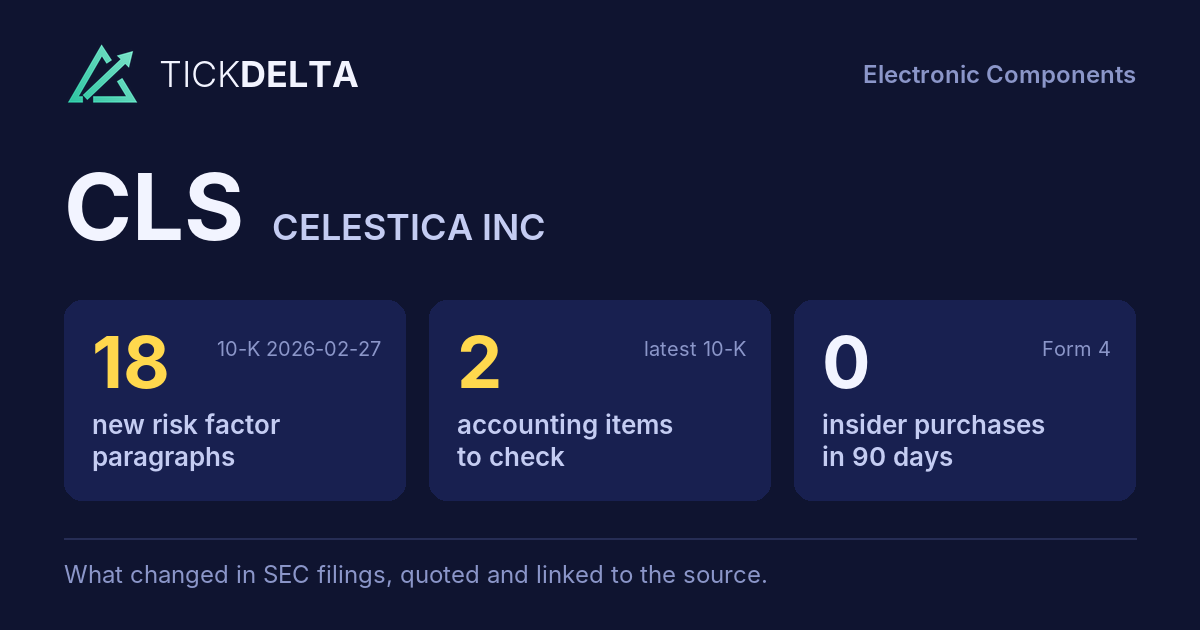
18 new risk paragraphs and 2 accounting facts worth reading about. 10-K filed Feb 27, 2026 against Mar 3, 2025.
Each row opens the detail with the quote and the filing. A row is a change worth reading, not a verdict.
Accounting checks
10 checks on the latest 10-K. Checks, not verdicts.
2facts worth reading about the other 8 checks found nothing to note
-
Cash from operations lower than net incomeCash from operations $659.5M vs net income $832.5M (FY ending Dec 31, 2025)
-
Critical audit matters changedNew this year: Toronto, Canada. No longer listed: Toronto, Canada February 28, 2025. Same as last year: Valuation of goodwill for the Capital Equipment reporting unit
-
Inventory +24.3% ($1.8B to $2.2B) vs revenue +28.5% ($9.6B to $12.4B), -4.2 pts apart
7 more checks with nothing to note
-
Same auditor in both 10-Ks: KPMG LLP
-
No statement of substantial doubt about going concern
-
No 8-K item 4.02 in the last 2 years
-
No NT 10-K or NT 10-Q in the last 2 years
-
No sentence in the 10-K concludes that controls were not effective because of a material weakness
-
No 8-K item 2.06 in the last 2 years
-
No 8-K item 1.03 in the last 2 years
In their words
18 paragraphs in Risk Factors that were not in the 10-K filed Mar 3, 2025. Quoted as filed.
-
Item 1A · new paragraph · not in the 10-K filed Mar 3, 2025 10-K, ITEM 1A
Our revenue is sensitive to the investment cycles and operating conditions of a limited number of customers, including hyperscalers. As spending patterns of our major customers are influenced by technology transitions and deployment priorities, including AI-related programs, demand for our offerings may be affected by: (i) changes in…
-
Item 1A · new paragraph · not in the 10-K filed Mar 3, 2025 10-K, ITEM 1A
The purchase of materials and electronic components represents a significant portion of our costs to deliver our manufactured products. Some of these components have in the past and could in the future be rationed in response to supply shortages. Changes in forecasted volumes or in our customers' requirements can also negatively affect…
-
Item 1A · new paragraph · not in the 10-K filed Mar 3, 2025 10-K, ITEM 1A
Increased capital expenditures to expand capacity to support anticipated growth in customer demand may not proceed as anticipated and may increase our fixed‑cost base, constrain liquidity and adversely affect returns. We anticipate our 2026 capital expenditures to be approximately $1 billion (about 6% of currently anticipated revenue),…
-
Item 1A · new paragraph · not in the 10-K filed Mar 3, 2025 10-K, ITEM 1A
Transfers of business or operations have increased and may again increase our costs and cause disruptions in our ability to service our customers. Our customers have in the past and may in the future require that we transfer the manufacturing of their products from one of our facilities to another to achieve cost reductions, tariff…
New risk paragraphs, against peers
Latest 10-K of each, Technology companies closest in revenue
Paragraphs in Risk Factors with nothing like them in the company's 10-K the year before. A count of text, not of risk.
Financial performance
Last 4 fiscal years · 10-K XBRL
| Metric | FY2022 | FY2023 | FY2024 | FY2025 |
|---|---|---|---|---|
| Revenue | $7.2B | $8.0B | $9.6B | $12.4B |
| Net income | $180.1M | $244.4M | $428.0M | $832.5M |
| Operating cash flow | $211.1M | $326.2M | $473.9M | $659.5M |
| Free cash flow | $102.1M | $201.1M | $303.0M | $458.3M |
Revenue, FY2022 to FY2025
Ten fiscal years, each from its own 10-K · XBRL · USD
$12.4B ▲ 28.5% in FY2025$832.5M ▲ 94.5% in FY2025$458.3M ▲ 51.3% in FY2025
Recent filings
5 filings in the last 30 days · SEC EDGAR
-
SEC letterNov 14, 2026SEC asked 10 questions about Schedule TO-I letters Nov 2, 2012 to Nov 16, 2012 · Legal and contingencies · no closing letter yet
-
8-KOct 30, 2026Regulation FD disclosure 8-K item 7.01
-
8-KOct 27, 2026Regulation FD disclosure 8-K item 7.01
-
8-KOct 26, 2026Quarterly results 8-K item 2.02
-
10-QOct 26, 2026Quarterly report (10-Q) period ended Sep 30, 2026
About the company
Celestica Inc, Toronto, A6 · from the 10-K filed Feb 27, 2026
We were incorporated in Ontario, Canada on September 27, 1996. We are a corporation domiciled in the Province of Ontario, Canada and operate under the Business Corporations Act (Ontario) (OBCA). Our principal executive offices and global headquarters are located at 5140 Yonge Street, Suite 1900, Toronto, Ontario, Canada M2N 6L7. Our telephone number is (416) 448-5800, and our internet address is www.celestica.com. We operate a network of sites and design centers strategically located in North America, Asia, and Europe. Information on our website is not incorporated by reference into this Annual Report.
- Headquarters
- Toronto, A6
- Country
- United States
- Reports in
- USD
- Listed on
- NYSE
- Fiscal year ends
- December 31
- Last results
- Oct 26, 2026
- Incorporated in
- Ontario, Canada
Email alerts
Sources
The 10-K filed Feb 27, 2026 (open at SEC), compared with the 10-K filed Mar 3, 2025. Numbers from the XBRL of the 10-Ks; filings from SEC EDGAR.
Work with it: Excel workbook · CSV. Google Sheet that stays up to date: paste =IMPORTDATA("https://tickdelta.com/company/CLS/export.csv") into a cell.