Sonic Automotive Inc SAH
Sonic Automotive, Inc. was incorporated in Delaware in 1997. 10-K, Item 1
- Employees
- 11,000
- Headquarters
- Charlotte, NC
- CEO
- David Bruton Smith
- Next results
- around Feb 17, 2027
Where each dollar of revenue went, FY2025
Revenue of $15.2B through the costs to a net profit of $118.7M · income statement of the 10-K
SAH among Consumer discretionary peers
Six ratios from the latest 10-K. Each corner is the share of 168 peers the company is above, not a score.
What changed
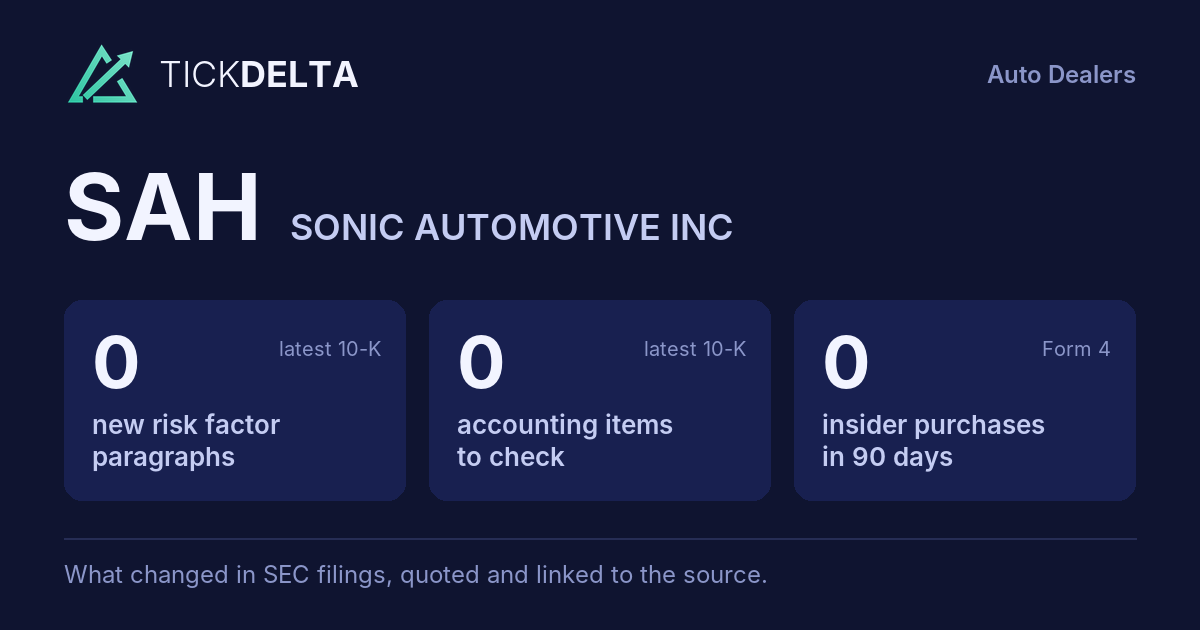
Nothing new in the latest 10-K.
Each row opens the detail with the quote and the filing. A row is a change worth reading, not a verdict.
Accounting checks
10 checks on the latest 10-K. Checks, not verdicts.
0facts worth reading about all 10 checks found nothing to note
-
Receivables -5.4% ($495.9M to $469.0M) vs revenue +6.5% ($14.2B to $15.2B), -12.0 pts apart
-
Cash from operations $567.4M vs net income $118.7M (FY ending Dec 31, 2025)
-
Inventory +2.8% ($2.0B to $2.0B) vs revenue +6.5% ($14.2B to $15.2B), -3.7 pts apart
7 more checks with nothing to note
-
Same auditor in both 10-Ks: Grant Thornton LLP
-
No statement of substantial doubt about going concern
-
No 8-K item 4.02 in the last 2 years
-
No NT 10-K or NT 10-Q in the last 2 years
-
No sentence in the 10-K concludes that controls were not effective because of a material weakness
-
No 8-K item 2.06 in the last 2 years
-
No 8-K item 1.03 in the last 2 years
In their words
No new paragraphs in Risk Factors
No new paragraphs in Risk Factors, or fewer than two 10-Ks to compare.
New risk paragraphs, against peers
Latest 10-K of each, Consumer discretionary companies closest in revenue
Paragraphs in Risk Factors with nothing like them in the company's 10-K the year before. A count of text, not of risk.
Financial performance
Last 4 fiscal years · 10-K XBRL
| Metric | FY2022 | FY2023 | FY2024 | FY2025 |
|---|---|---|---|---|
| Revenue | $14.0B | $14.4B | $14.2B | $15.2B |
| Net income | $88.5M | $178.2M | $216.0M | $118.7M |
| Operating cash flow | $406.1M | −$15.7M | $109.2M | $567.4M |
| Free cash flow | $633.2M | $187.9M | $296.5M | $717.3M |
Revenue, FY2016 to FY2025
Ten fiscal years, each from its own 10-K · XBRL · USD
$15.2B ▲ 6.5% in FY2025$118.7M ▼ 45.0% in FY2025$717.3M ▲ 141.9% in FY2025
Recent filings
2 filings in the last 30 days · SEC EDGAR
-
8-KOct 29, 2026Quarterly results, Regulation FD disclosure 8-K items 2.02, 7.01
-
10-QOct 29, 2026Quarterly report (10-Q) period ended Oct 29, 2026
About the company
Sonic Automotive Inc, Charlotte, NC · from the 10-K filed Feb 23, 2026
Sonic Automotive, Inc. was incorporated in Delaware in 1997. References to “Sonic,” the “Company,” “we,” “us” or “our” used throughout this Annual Report on Form 10-K refer to Sonic Automotive, Inc. and its subsidiaries. We are one of the largest automotive retailers in the United States (the “U.S.”) (as measured by reported total revenue). As a result of the way we manage our business, we had three reportable segments as of December 31, 2025: (1) the Franchised Dealerships Segment; (2) the EchoPark Segment; and (3) the Powersports Segment.
- Headquarters
- Charlotte, NC
- Country
- United States
- Reports in
- USD
- Listed on
- NYSE
- Fiscal year ends
- December 31
- Last results
- Oct 29, 2026
- Incorporated in
- DE
Employees, at the top of the page: "As of December 31, 2025, we had approximately 11,000 employees, which we refer to as associates or teammates, and with whom we strive to maintain good relationships, which benefit both our Company and our teammates" (10-K). Address and exchange: SEC's company file.
Email alerts
Sources
Numbers from the XBRL of the 10-Ks; filings from SEC EDGAR.
Work with it: Excel workbook · CSV. Google Sheet that stays up to date: paste =IMPORTDATA("https://tickdelta.com/company/SAH/export.csv") into a cell.