Element Solutions Inc ESI
Element Solutions, incorporated in Delaware in January 2014, is a leading global specialty chemicals technology company whose businesses supply a broad range of solutions that enhance the performance of products people use every day. 10-K, Item 1
- Employees
- 5,200
- Headquarters
- Miami Beach, FL
- Next results
- around Feb 16, 2027
Where each dollar of revenue went, FY2025
Revenue of $2.6B through the costs to a net profit of $190.8M · income statement of the 10-K
ESI among Materials peers
Six ratios from the latest 10-K. Each corner is the share of 84 peers the company is above, not a score.
What changed
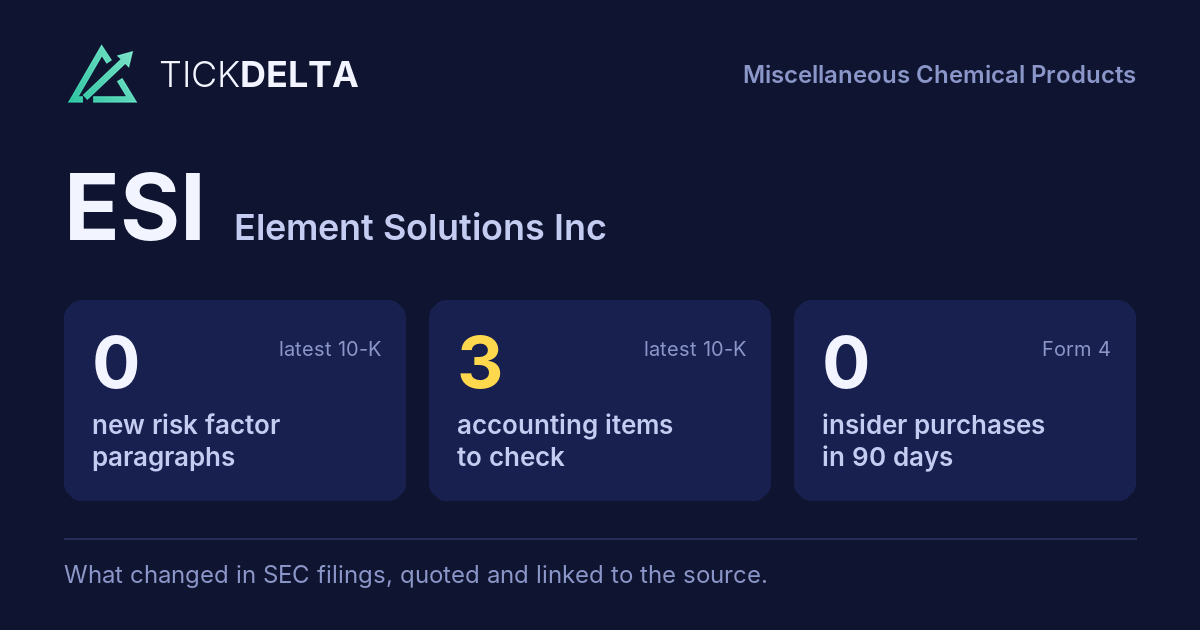
3 accounting facts worth reading about.
Each row opens the detail with the quote and the filing. A row is a change worth reading, not a verdict.
Accounting checks
11 checks on the latest 10-K. Checks, not verdicts.
3facts worth reading about the other 8 checks found nothing to note
-
Receivables growing faster than revenueReceivables +17.8% ($439.6M to $517.7M) vs revenue +3.8% ($2.5B to $2.6B), +13.9 pts apart
-
Inventory growing faster than revenueInventory +19.7% ($246.2M to $294.7M) vs revenue +3.8% ($2.5B to $2.6B), +15.9 pts apart
-
Critical audit matters changedNew this year: Income Taxes - Valuation of U.K. Deferred Tax Assets (“As described in Notes 2 and 11 to the consolidated financial statements, the Company has $274.4 million of deferred tax assets as of December 31, 2025, inclusive of $63.1 million of valuation allowances. A portion of these deferred tax assets and valuation allowances relates to the U.K. The Company ”). No longer listed: Valuation Allowance Assessment of U.K. Deferred Tax Assets
-
Cash from operations $289.8M vs net income $190.8M (FY ending Dec 31, 2025)
7 more checks with nothing to note
-
Same auditor in both 10-Ks: PricewaterhouseCoopers LLP
-
No statement of substantial doubt about going concern
-
No 8-K item 4.02 in the last 2 years
-
No NT 10-K or NT 10-Q in the last 2 years
-
No sentence in the 10-K concludes that controls were not effective because of a material weakness
-
No 8-K item 2.06 in the last 2 years
-
No 8-K item 1.03 in the last 2 years
In their words
No new paragraphs in Risk Factors
No new paragraphs in Risk Factors, or fewer than two 10-Ks to compare.
New risk paragraphs, against peers
Latest 10-K of each, Materials companies closest in revenue
Paragraphs in Risk Factors with nothing like them in the company's 10-K the year before. A count of text, not of risk.
Financial performance
Last 4 fiscal years · 10-K XBRL
| Metric | FY2022 | FY2023 | FY2024 | FY2025 |
|---|---|---|---|---|
| Revenue | $2.5B | $2.3B | $2.5B | $2.6B |
| Net income | $187.2M | $118.1M | $244.2M | $190.8M |
| Operating cash flow | $295.9M | $333.6M | $362.0M | $289.8M |
| Free cash flow | $248.1M | $280.9M | $293.6M | $227.6M |
Revenue, FY2016 to FY2025
Ten fiscal years, each from its own 10-K · XBRL · USD
$2.6B ▲ 3.8% in FY2025$190.8M ▼ 21.9% in FY2025$227.6M ▼ 22.5% in FY2025
Recent filings
2 filings in the last 30 days · SEC EDGAR
-
10-QOct 22, 2026Quarterly report (10-Q) period ended Sep 30, 2026
-
8-KOct 21, 2026Quarterly results 8-K item 2.02
About the company
Element Solutions Inc, Miami Beach, FL · from the 10-K filed Feb 18, 2026
Element Solutions, incorporated in Delaware in January 2014, is a leading global specialty chemicals technology company whose businesses supply a broad range of solutions that enhance the performance of products people use every day. Developed in multi-step technological processes, these innovative solutions enable customers' manufacturing processes in multiple high-value industries, including consumer electronics, power electronics, semiconductor fabrication, high-performance computing, communications and data storage infrastructure, automotive systems, industrial surface finishing and offshore energy.
- Headquarters
- Miami Beach, FL
- Country
- United States
- Reports in
- USD
- Listed on
- NYSE
- Fiscal year ends
- December 31
- Last results
- Oct 21, 2026
Employees, at the top of the page: "At December 31, 2025, we employed approximately 5,200 full-time employees, of which approximately 40% are research and development chemists and experienced technical service and technical sales personnel" (10-K). Address and exchange: SEC's company file.
Email alerts
Sources
Numbers from the XBRL of the 10-Ks; filings from SEC EDGAR.
Work with it: Excel workbook · CSV. Google Sheet that stays up to date: paste =IMPORTDATA("https://tickdelta.com/company/ESI/export.csv") into a cell.