Arista Networks ANET
In a world where data is increasingly a precious commodity and competitive differentiator, Arista was founded to enable our customers to access all their centers of data in the quickest, most reliable, and secure manner. 10-K, Item 1
- Employees
- 5,115
- Headquarters
- Santa Clara, CA
- CEO
- Jayshree Ullal
- Next results
- around Feb 11, 2027
Where each dollar of revenue went, FY2025
Revenue of $9.0B through the costs to a net profit of $3.5B · income statement of the 10-K
ANET among Technology peers
Six ratios from the latest 10-K. Each corner is the share of 74 peers the company is above, not a score.
What changed
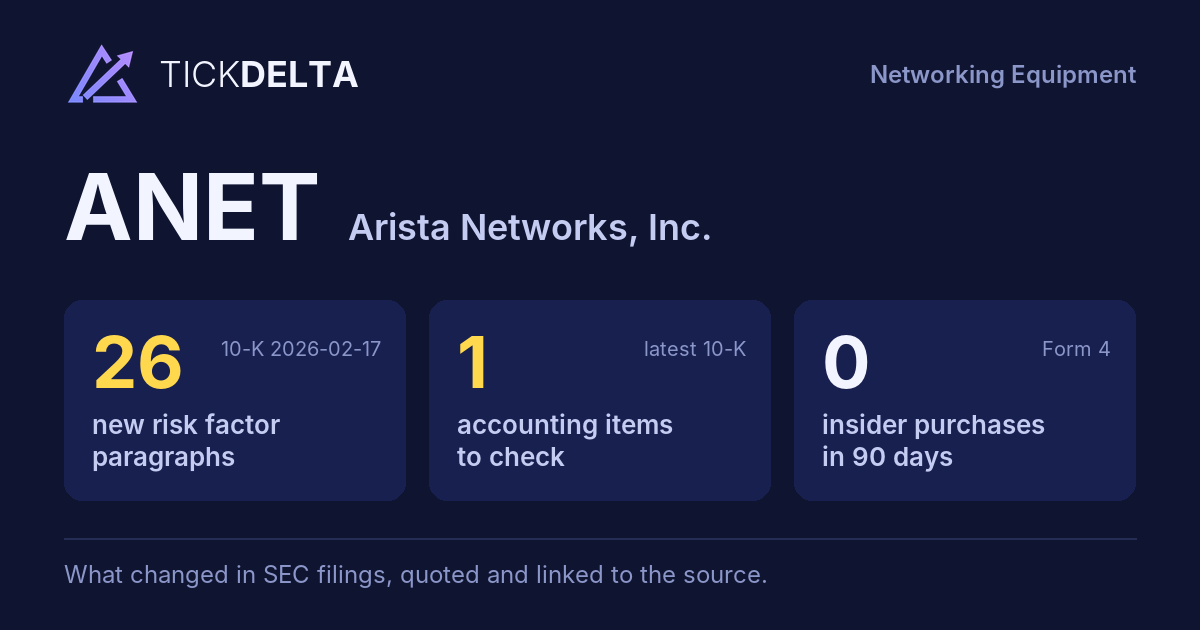
26 new risk paragraphs and 1 accounting fact worth reading about. 10-K filed Feb 17, 2026 against Feb 19, 2025.
Each row opens the detail with the quote and the filing. A row is a change worth reading, not a verdict.
Accounting checks
11 checks on the latest 10-K. Checks, not verdicts.
1fact worth reading about the other 10 checks found nothing to note
-
Receivables growing faster than revenueReceivables +65.4% vs revenue +28.6% (+36.8 pts)
-
Cash from operations $4.4B vs net income $3.5B (FY ending Dec 31, 2025)
9 more checks with nothing to note
-
Inventory +22.5% vs revenue +28.6% (-6.1 pts)
-
Same auditor in both 10-Ks: Ernst & Young LLP
-
No statement of substantial doubt about going concern
-
No 8-K item 4.02 in the last 2 years
-
No NT 10-K or NT 10-Q in the last 2 years
-
The same matters as last year: Inventory Valuation and Supplier Liabilities
-
No sentence in the 10-K concludes that controls were not effective because of a material weakness
-
No 8-K item 2.06 in the last 2 years
-
No 8-K item 1.03 in the last 2 years
In their words
26 paragraphs in Risk Factors that were not in the 10-K filed Feb 19, 2025. Quoted as filed.
-
Item 1A · new paragraph · not in the 10-K filed Feb 19, 2025 10-K, ITEM 1A
Our products are primarily manufactured in Malaysia, Vietnam, and Mexico, and we also procure a limited number of products originating from China, Taiwan, Thailand and the Philippines. In addition, our contract manufacturing partners procure some components from China for use in the manufacturing of our products. Because our products…
-
Item 1A · new paragraph · not in the 10-K filed Feb 19, 2025 10-K, ITEM 1A
New and changing laws, regulations, executive orders, directives, and enforcement priorities can adversely affect the Company’s business by increasing the Company’s costs, limiting the Company’s ability to continuously navigate global supply chain options in lieu of optimizing tariff outcomes, offer a product or service to customers in…
-
Item 1A · new paragraph · not in the 10-K filed Feb 19, 2025 10-K, ITEM 1A
We, or third parties on which we rely, could experience cybersecurity incidents relating to our information systems, or our products, services, or data, which could disrupt our operations or our ability to provide services, cause vulnerabilities or perceived vulnerabilities in our product, compromise intellectual property or other…
-
Item 1A · new paragraph · not in the 10-K filed Feb 19, 2025 10-K, ITEM 1A
The U.S. government also recently introduced regulations that require notification of or prohibit certain transactions by the Company with entities in China or with certain linkages to China. These regulations could apply to certain intracompany activities with our China and Hong Kong subsidiaries or other activities with entities in…
New risk paragraphs, against peers
Latest 10-K of each, Technology companies closest in revenue
Paragraphs in Risk Factors with nothing like them in the company's 10-K the year before. A count of text, not of risk.
Financial performance
Last 4 fiscal years · 10-K XBRL
| Metric | FY2022 | FY2023 | FY2024 | FY2025 |
|---|---|---|---|---|
| Revenue | $4.4B | $5.9B | $7.0B | $9.0B |
| Net income | $1.4B | $2.1B | $2.9B | $3.5B |
| Operating cash flow | $492.8M | $2.0B | $3.7B | $4.4B |
| Free cash flow | $448.2M | $2.0B | $3.7B | $4.3B |
Revenue, FY2016 to FY2025
Ten fiscal years, each from its own 10-K · XBRL · USD
$9.0B ▲ 28.6% in FY2025$3.5B ▲ 23.1% in FY2025$4.3B ▲ 15.7% in FY2025
Recent filings
2 filings in the last 30 days · SEC EDGAR
-
10-QNov 4, 2026Quarterly report (10-Q) period ended Sep 30, 2026
-
8-KNov 3, 2026Quarterly results 8-K item 2.02
About the company
Arista Networks, Santa Clara, CA · from the 10-K filed Feb 17, 2026
In a world where data is increasingly a precious commodity and competitive differentiator, Arista was founded to enable our customers to access all their centers of data in the quickest, most reliable, and secure manner. Over the last two decades, we have emerged as an industry leader, delivering data-driven, client-to-cloud networking-as-a-service. Our “Centers of Data” strategy is a fundamental pivot from legacy networking approaches that create incongruent silos to a unified, data-driven approach in which the network is a service that interconnects four primary domains: AI Centers, Data Centers, Campus Centers, and WAN Centers.
- Headquarters
- Santa Clara, CA
- Country
- United States
- Listed on
- NYSE
- Fiscal year ends
- December 31
- Last results
- Nov 3, 2026
- Incorporated in
- DE
Employees, at the top of the page: "As of December 31, 2025, Arista employed approximately 5,115 full-time employees worldwide" (10-K). Address and exchange: SEC's company file.
Email alerts
Sources
The 10-K filed Feb 17, 2026 (open at SEC), compared with the 10-K filed Feb 19, 2025. Numbers from the XBRL of the 10-Ks; filings from SEC EDGAR.
Work with it: Excel workbook · CSV. Google Sheet that stays up to date: paste =IMPORTDATA("https://tickdelta.com/company/ANET/export.csv") into a cell.