Bellring Brands, Inc. BRBR
- Headquarters
- Clayton, MO
- CEO
- Michael Carey Axelrod
- Next results
- around Nov 17, 2026
Where each dollar of revenue went, FY2025
Revenue of $2.3B through the costs to a net profit of $216.2M · income statement of the 10-K
BRBR among Consumer staples peers
Six ratios from the latest 10-K. Each corner is the share of 63 peers the company is above, not a score.
What changed
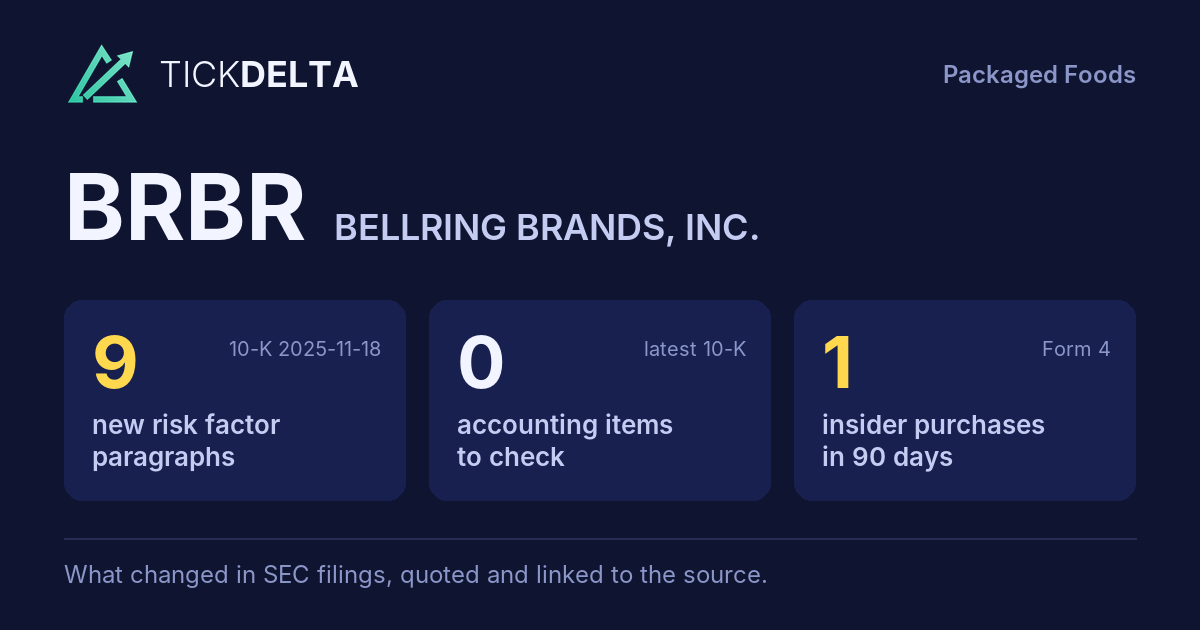
9 new risk paragraphs. 10-K filed Nov 18, 2025 against Nov 19, 2024.
Each row opens the detail with the quote and the filing. A row is a change worth reading, not a verdict.
Accounting checks
11 checks on the latest 10-K. Checks, not verdicts.
0facts worth reading about all 11 checks found nothing to note
-
Receivables +1.4% ($220.4M to $223.4M) vs revenue +16.1% ($2.0B to $2.3B), -14.7 pts apart
-
Cash from operations $260.6M vs net income $216.2M (FY ending Sep 30, 2025)
-
Inventory +15.5% ($286.1M to $330.4M) vs revenue +16.1% ($2.0B to $2.3B), -0.6 pts apart
8 more checks with nothing to note
-
Same auditor in both 10-Ks: PricewaterhouseCoopers LLP
-
No statement of substantial doubt about going concern
-
No 8-K item 4.02 in the last 2 years
-
No NT 10-K or NT 10-Q in the last 2 years
-
The same matters as last year: Receivables, net - Allowance for Trade Promotions
-
No sentence in the 10-K concludes that controls were not effective because of a material weakness
-
No 8-K item 2.06 in the last 2 years
-
No 8-K item 1.03 in the last 2 years
In their words
9 paragraphs in Risk Factors that were not in the 10-K filed Nov 19, 2024. Quoted as filed.
-
Item 1A · new paragraph · not in the 10-K filed Nov 19, 2024 10-K, ITEM 1A
Increasing scrutiny and evolving expectations and in some cases conflicting expectations from customers, suppliers, regulators, investors, and other stakeholders with respect to our environmental, social and governance (“ESG”) practices may impose additional costs on us or expose us to new or additional risks. Companies are facing…
New risk paragraphs, against peers
Latest 10-K of each, Consumer staples companies closest in revenue
Paragraphs in Risk Factors with nothing like them in the company's 10-K the year before. A count of text, not of risk.
Financial performance
Last 4 fiscal years · 10-K XBRL
| Metric | FY2022 | FY2023 | FY2024 | FY2025 |
|---|---|---|---|---|
| Revenue | $1.4B | $1.7B | $2.0B | $2.3B |
| Net income | $82.3M | $165.5M | $246.5M | $216.2M |
| Operating cash flow | $21.0M | $215.6M | $199.6M | $260.6M |
| Free cash flow | $19.2M | $213.8M | $197.8M | $255.9M |
Revenue, FY2018 to FY2025
Ten fiscal years, each from its own 10-K · XBRL · USD
$2.3B ▲ 16.1% in FY2025$216.2M ▼ 12.3% in FY2025$255.9M ▲ 29.4% in FY2025
Recent filings
1 filing in the last 30 days · SEC EDGAR
-
SEC letterNov 13, 2026SEC asked 15 questions about Form S-1 letters May 3, 2019 to Oct 15, 2019 · Results discussion (MD&A), Risk factors, Income taxes · no closing letter yet
About the company
Bellring Brands, Inc., Clayton, MO · from the 10-K filed Nov 18, 2025
BellRing Brands, Inc. (formerly known as BellRing Distribution, LLC) (“BellRing”) was formed in the State of Delaware on October 20, 2021 as a wholly-owned subsidiary of Post Holdings, Inc. (“Post”) for the purpose of effecting the separation of BellRing Intermediate Holdings, Inc. (formerly known as BellRing Brands, Inc.) (“Old BellRing”) from Post.
- Headquarters
- Clayton, MO
- Country
- United States
- Reports in
- USD
- Listed on
- NYSE
- Fiscal year ends
- September 30
- Last results
- Aug 4, 2026
Email alerts
Sources
The 10-K filed Nov 18, 2025 (open at SEC), compared with the 10-K filed Nov 19, 2024. Numbers from the XBRL of the 10-Ks; filings from SEC EDGAR.
Work with it: Excel workbook · CSV. Google Sheet that stays up to date: paste =IMPORTDATA("https://tickdelta.com/company/BRBR/export.csv") into a cell.