Paragraph 100 · 47% changed
Every version of it
Screener
/
SEC EDGAR
/CIK 0001424182
/10-K filed Feb 19, 2026, compared with Feb 20, 2025
/Numbers from the XBRL of the 10-Ks
NYSE
Real estate · REIT
Broadstone Net Lease, Inc. BNL
The 10-K against last year's
105 changes: 15 added, 20 removed, 68 reworded, 2 quiet changes
10-K Feb 19, 2026 vs Feb 20, 2025
Risk Factors
11.8%
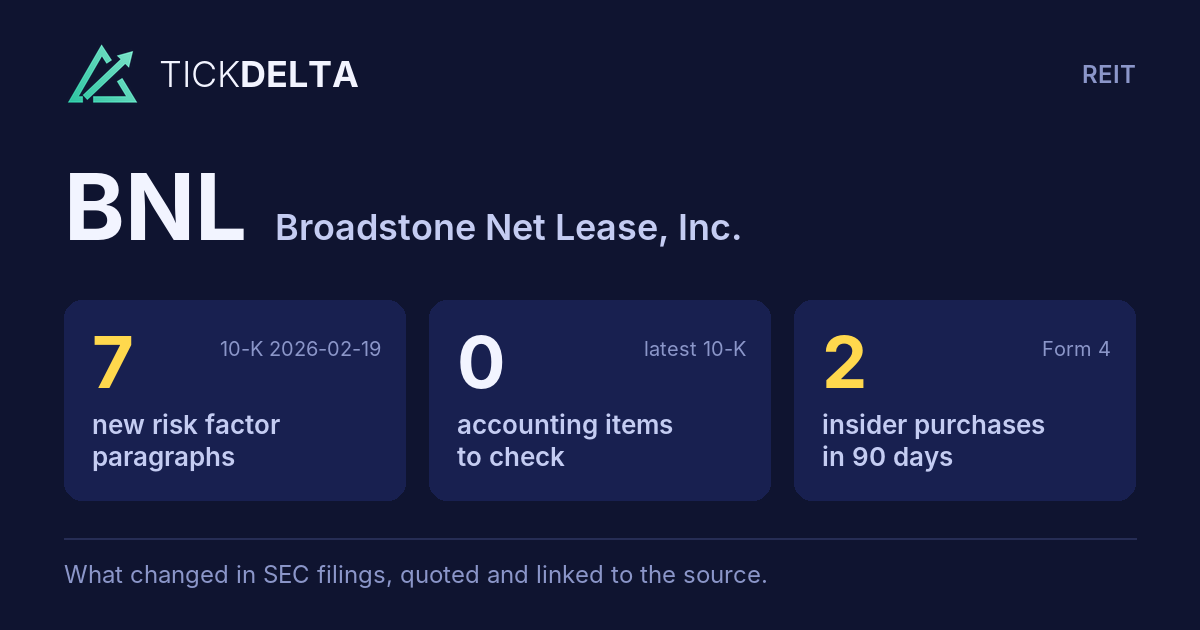
of the text changed · 17,558 words now · 7 new paragraphs, 7 gone
MD&A
15.5%
of the text changed · 11,793 words now · 8 new paragraphs, 13 gone
Legal Proceedings
52.1%
of the text changed · 810 words now
Accounting Policies
8.9%
of the text changed · 8,487 words now
10-K 0001424182-26-000012 (Feb 19, 2026) vs 10-K 0000950170-25-024123 (Feb 20, 2025)
Every paragraph, and how much of it changed
One bar per paragraph, in the order of the 10-K. Height and colour show the share of its words not in the closest paragraph a year earlier; the tallest bars are new paragraphs.
Risk Factors
214 paragraphs · 7 new · 43 reworded · 7 gone · 10-K Feb 19, 2026 against Feb 20, 2025
New paragraph
Reworded (5% of its words or more)
Same or nearly
Paragraph 185 · 46% changed
Every version of it
The REIT provisions of the Code substantially limit our ability to hedge our assets and liabilities. Any income from a hedging transaction that we enter into to manage the risk of interest rate changes with respect to borrowings made or to be made to acquire or carry real estate assets, or from certain terminations of such hedging positions, does not constitute “gross income” for purposes of the 75% or 95% gross income tests that apply to REITs, provided that certain identification requirements are met. To the extent that we enter into other types of hedging transactions or fail to properly identify such transaction as a hedge, the income is likely to be treated as non-qualifying income for purposes of the 75% and 95% gross income tests. As a result of these rules, we may be required to limit our use of advantageous hedging techniques or implement those hedges through a TRS. This could increase the cost of our hedging activities because any TRS in which we own an interest may be subject to tax on gains or expose us to greater risks associated with changes in interest rates than we would otherwise want to bear. In addition, losses in any TRS in which we own an interest will generally not provide any tax benefit, except that such losses may be carried forward and may be deducted against 80% of future taxable income in the TRS.
Paragraph 175 · 42% changed
Every version of it
Paragraph 90 · 39% changed
Every version of it
Paragraph 164 · 38% changed
Every version of it
Paragraph 37 · 37% changed
Every version of it
As of December 31, 2024, 2025, approximately 37.2% 35.4% of our ABR came from properties in our top five states: Texas (9.6%), (10.2%), Michigan (9.2%), (8.6%), Florida (6.5%), (5.9%), Illinois (5.4%), and California (6.1%), and Illinois (5.8%). (5.3%). These geographic concentrations could adversely affect our operating performance if conditions become less favorable in any of the states or markets within which we have a concentration of properties. We can provide no assurance that any of our markets will grow, will not experience adverse developments, or that underlying real estate fundamentals will be favorable to owners and operators of industrial, retail, and other properties. A downturn in the economy in the states or regions in which we have a concentration of properties, or markets within such states or regions, or a slowdown in the demand for our tenants’ businesses caused by adverse economic, regulatory, or other conditions, could adversely affect our tenants operating businesses in those states and impair their ability to pay rent to us, which, in turn could materially and adversely affect us.
Paragraph 132 · 37% changed
Every version of it
The occurrence of any of these events could materially and adversely affect us. To the extent new indebtedness is added to our current debt levels, the related risks that we now face would increase. As a result, we are and will be subject to risks associated with debt financing, including the risk that our cash flow could be insufficient to make required payments on our debt or to pay dividends on our common stock. Furthermore, foreclosures could create taxable income without accompanying cash proceeds, which could hinder our ability to meet the REIT distribution requirements imposed by the Code.
Paragraph 71 · 37% changed
Every version of it
We may explore and enter into new transaction structures, including real estate lending opportunities opportunities, the provision of transitional capital, and joint ventures, that may or may not be closely related to our current business. These new transaction structures may have new, different, or increased risks than what we are currently exposed to in our business and we may not be able to manage these risks successfully. Additionally, when investing in such new transaction structures, we will be exposed to the risk that those structures, or the income generated thereby, will affect our ability to meet the requirements to maintain our REIT status and to avoid entity-level taxes, or will subject us to additional regulatory requirements or limitations. If we are not able to successfully manage the risks associated with such new transaction structures, it could have an adverse effect on our business, results of operations, and financial condition.
Paragraph 100 · 47% changed
Every version of it
10-K Feb 20, 2025The departure of any of our key personnel with long-standing business relationships could materially and adversely affect us.
10-K Feb 19, 2026
relationships with lenders, business partners, existing and prospective tenants, and industry personnel, which could materially and adversely affect us.
Paragraph 185 · 46% changed
Every version of it
10-K Feb 20, 2025
The REIT provisions of the Code substantially limit our ability to hedge our assets and liabilities. Any income from a hedging transaction that we enter into to manage the risk of interest rate changes with respect to borrowings made or to be made to acquire or carry real estate assets, or from certain terminations of such hedging positions, does not constitute “gross income” for purposes of the 75% or 95% gross income tests that apply to REITs, provided that certain identification requirements are met. To the extent that we enter into other types of hedging transactions or fail to properly identify such transaction as a hedge, the income is likely to be treated as non-qualifying income for purposes of the 75% and 95% gross income tests. As a result of these rules, we may be required to limit our use of advantageous hedging techniques or implement those hedges through a TRS. This could increase the cost of our hedging activities because any TRS in which we own an interest may be subject to tax on gains or expose us to greater risks associated with changes in interest rates than we would otherwise want to bear. In addition, losses in any TRS in which we own an interest will generally not provide any tax benefit, except that such losses may be carried forward and may be deducted against 80% of future taxable income in the TRS.
10-K Feb 19, 2026
The REIT provisions of the Code substantially limit our ability to hedge our assets and liabilities. Any income from a hedging transaction that we enter into to manage the risk of interest rate changes with respect to borrowings made or to be made to acquire or carry real estate assets, or from certain terminations of such hedging positions, does not constitute
Paragraph 175 · 42% changed
Every version of it
10-K Feb 20, 2025Even if we qualify as a REIT, we may be subject to certain U.S. federal, state and local taxes on our income and assets, including taxes on any undistributed income, tax on income from some activities conducted as a result of a foreclosure, and state or local transfer taxes. In addition, we will be subject to a 4% nondeductible excise tax if the actual amount that we distribute to our stockholders in a calendar year is less than a minimum amount specified under the Code. Finally, we could, in certain circumstances, be required to pay an excise or penalty tax or interest charge (which could be significant in amount) in order to utilize one or more relief provisions under the Code to maintain our qualification as a REIT and to avoid the imposition of an entity-level tax. Any of these taxes or interest charges would decrease cash available for distribution to our stockholders. In addition, in order to meet the REIT Requirements, or to avert the imposition of a 100% tax that applies to certain gains derived by a REIT from dealer property or inventory, we have held, and may continue to hold, some of our assets through a TRS that is subject to U.S. federal, state and local corporate taxes. Any of these taxes would decrease cash available for distribution to our stockholders.
10-K Feb 19, 2026
tax that applies to certain gains derived by a REIT from dealer property or inventory, we have held, and may continue to hold, some of our assets through a TRS that is subject to U.S. federal, state and local corporate taxes. Any of these taxes would decrease cash available for distribution to our stockholders.
Paragraph 90 · 39% changed
Every version of it
10-K Feb 20, 2025There may be known or unknown environmental liabilities associated with properties we previously owned, currently own, or may acquire in the future. Under various federal, state, and local laws and regulations relating to the environment, as a current or former owner or operator of real property, we may be liable for costs and damages resulting from environmental matters, including the presence or discharge of hazardous or toxic substances, waste, asbestos-containing building materials, or petroleum products at, on, in, under or migrating from such property, including costs to investigate or clean up such contamination and liability for personal injury, property damage, or harm to natural resources. Such laws often impose liability without regard to whether the owner or operator knew of, or was responsible for, the presence of such contamination. These costs and damages could be substantial. Certain uses of some properties may have a heightened risk of environmental liability because of the hazardous materials used in performing services on those properties, such as industrial properties or businesses using petroleum products, paint, machine solvents, and other hazardous materials. We typically undertake customary environmental diligence prior to our acquisition of any property, including obtaining Phase I environmental site assessments. The Phase I environmental site assessments are limited in scope and therefore may not reveal all environmental conditions affecting a property. Therefore, there could be undiscovered environmental liabilities on the properties we own.
10-K Feb 19, 2026
performing services on those properties, such as industrial properties or businesses using petroleum products, paint, machine solvents, and other hazardous materials. We typically undertake customary environmental diligence prior to our acquisition of any property, including obtaining Phase I environmental site assessments. The Phase I environmental site assessments are limited in scope and therefore may not reveal all environmental conditions affecting a property. Therefore, there could be undiscovered environmental liabilities on the properties we own.
Paragraph 164 · 38% changed
Every version of it
10-K Feb 20, 2025Conflicts of interest could arise in the future as a result of the relationships between us and our affiliates, on the one hand, and the OP or any future member thereof, on the other. Our directors and officers have duties to our Company under applicable Maryland law in connection with the management of our Company. At the same time, we, as the managing member of the OP, will have fiduciary duties and obligations to the OP and its members under New York law and the OP Agreement in connection with the management of the OP. Our fiduciary duties and obligations, as the managing member of the OP, and its members may come into conflict with the duties of our directors and officers to our Company.
10-K Feb 19, 2026
Agreement in connection with the management of the OP. Our fiduciary duties and obligations, as the managing member of the OP, and its members may come into conflict with the duties of our directors and officers to our Company.
Paragraph 37 · 37% changed
Every version of it
10-K Feb 20, 2025
As of December 31, 2024, approximately 37.2% of our ABR came from properties in our top five states: Texas (9.6%), Michigan (9.2%), Florida (6.5%), California (6.1%), and Illinois (5.8%). These geographic concentrations could adversely affect our operating performance if conditions become less favorable in any of the states or markets within which we have a concentration of properties. We can provide no assurance that any of our markets will grow, will not experience adverse developments, or that underlying real estate fundamentals will be favorable to owners and operators of industrial, retail, and other properties. A downturn in the economy in the states or regions in which we have a concentration of properties, or markets within such states or regions, or a slowdown in the demand for our tenants’ businesses caused by adverse economic, regulatory, or other conditions, could adversely affect our tenants operating businesses in those states and impair their ability to pay rent to us, which, in turn could materially and adversely affect us.
10-K Feb 19, 2026
As of December 31, 2025, approximately 35.4% of our ABR came from properties in our top five states: Texas (10.2%), Michigan (8.6%), Florida (5.9%), Illinois (5.4%), and California (5.3%). These geographic concentrations could adversely affect our operating performance if conditions become less favorable in any of the states or markets within which we have
Paragraph 132 · 37% changed
Every version of it
10-K Feb 20, 2025
The occurrence of any of these events could materially and adversely affect us. Furthermore, foreclosures could create taxable income without accompanying cash proceeds, which could hinder our ability to meet the REIT distribution requirements imposed by the Code.
10-K Feb 19, 2026
The occurrence of any of these events could materially and adversely affect us. To the extent new indebtedness is added to our current debt levels, the related risks that we now face would increase. As a result, we are and will be subject to risks associated with debt financing, including the risk that our cash flow could be insufficient to make required payments on our debt or to pay dividends on our common stock. Furthermore, foreclosures could create taxable income without accompanying cash proceeds, which could hinder our ability to meet the REIT distribution requirements imposed by the Code.
Paragraph 71 · 37% changed
Every version of it
10-K Feb 20, 2025
We may explore and enter into new transaction structures, including real estate lending opportunities and joint ventures, that may or may not be closely related to our current business. These new transaction structures may have new, different, or increased risks than what we are currently exposed to in our business and we may not be able to manage these risks successfully. Additionally, when investing in such new transaction structures, we will be exposed to the risk that those structures, or the income generated thereby, will affect our ability to meet the requirements to maintain our REIT status and to avoid entity-level taxes, or will subject us to additional regulatory requirements or limitations. If we are not able to successfully manage the risks associated with such new transaction structures, it could have an adverse effect on our business, results of operations, and financial condition.
10-K Feb 19, 2026
We may explore and enter into new transaction structures, including real estate lending opportunities, the provision of transitional capital, and joint ventures, that may or may not be closely related to our current business. These new transaction structures may have new, different, or increased risks than what we are currently exposed to in our business and
MD&A
150 paragraphs · 8 new · 68 reworded · 13 gone · 10-K Feb 19, 2026 against Feb 20, 2025
New paragraph
Reworded (5% of its words or more)
Same or nearly
Paragraph 4 · 44% changed
Paragraph 56 · 39% changed
As detailed in the contractual obligations table below, we have approximately $300.4 $383.4 million of expected obligations due throughout 2025, primarily 2026, consisting of $169.0 $197.6 million of commitments to fund investments, $57.2 million of dividends declared, $54.1 $107.8 million of projected interest expense, and $20.2 million of mortgage amortization. We expect our cash provided by operating activities, as discussed below, will be sufficient to pay for our current obligations including interest and mortgage amortization. We expect to pay for commitments to fund investments and our dividends declared using our Revolving Credit Facility. As of December 31, 2024, we have $907.0 million of available capacity under our Revolving Credit Facility.
Paragraph 69 · 37% changed
Paragraph 70 · 37% changed
Paragraph 83 · 37% changed
Paragraph 84 · 37% changed
Paragraph 16 · 35% changed
Paragraph 29 · 35% changed
We anticipate that we will continue to incur debt to fund future investment activity, which will increase the amount of interest expense we incur. In addition, although we attempt to limit our total floating-rate debt exposure, changes in the interest rate environment could either increase or decrease our weighted average interest rate in the future. As of December 31, 2024, 97.2% 2025, 87.2% of our $1.9 $2.5 billion of debt is fixed through fixed rates and $939.5 $943.0 million of interest rate swap notional. As interest rate swaps mature, we will be subject to interest rate risk from changes in rates on our floating-rate debt to the extent we do not enter into new interest rate swaps. Any changes to our debt structure or debt financing associated with property investments, could materially influence our operating results depending on the terms of any such debt. Our current investment grade credit ratings are ‘BBB’ from S&P Global Ratings (“S&P”) and ‘Baa2’ from Moody’s Investors Service (“Moody’s”), which allow us to take advantage of the lower cost of debt. However, a downgrade in our credit rating, or interest rate change due to governmental monetary and tax policies, domestic and international economic and political conditions, or other factors beyond our control, could also increase the amount of interest we pay under our debt agreements.
Paragraph 4 · 44% changed
10-K Feb 20, 2025We are an industrial-focused, diversified net lease real estate investment trust (“REIT”) that invests in primarily single-tenant commercial real estate properties that are net leased on a long-term basis to a diversified group of tenants. As of December 31, 2024, our portfolio includes 765 properties, with 758 properties located in 44 U.S. states and seven properties located in four Canadian provinces.
10-K Feb 19, 2026
December 31, 2025, our portfolio includes 771 properties, with 764 properties located in 44 U.S. states and seven properties located in four Canadian provinces.
Paragraph 56 · 39% changed
10-K Feb 20, 2025
As detailed in the contractual obligations table below, we have approximately $300.4 million of expected obligations due throughout 2025, primarily consisting of $169.0 million of commitments to fund investments, $57.2 million of dividends declared, $54.1 million of projected interest expense, and $20.2 million of mortgage amortization. We expect our cash provided by operating activities, as discussed below, will be sufficient to pay for our current obligations including interest and mortgage amortization. We expect to pay for commitments to fund investments and our dividends declared using our Revolving Credit Facility. As of December 31, 2024, we have $907.0 million of available capacity under our Revolving Credit Facility.
10-K Feb 19, 2026
As detailed in the contractual obligations table below, we have approximately $383.4 million of expected obligations due throughout 2026, consisting of $197.6 million of commitments to fund investments, $107.8 million of projected interest
Paragraph 69 · 37% changed
10-K Feb 20, 2025(d)Our Revolving Credit Facility contains two six-month extension options subject to certain conditions, including the payment of an extension fee equal to 0.0625% of the revolving commitments.
10-K Feb 19, 2026
(e)The 2028 Unsecured Term Loan contains two twelve-month extension options subject to certain conditions, including the payment of an extension fee equal to 0.125% of the aggregate principal amount of the loans outstanding under the 2028 term loan facility.
Paragraph 70 · 37% changed
10-K Feb 20, 2025(d)Our Revolving Credit Facility contains two six-month extension options subject to certain conditions, including the payment of an extension fee equal to 0.0625% of the revolving commitments.
10-K Feb 19, 2026
(f)The 2029 Unsecured Term Loan contains two twelve-month extension options subject to certain conditions, including the payment of an extension fee equal to 0.10% of the aggregate principal amount of the loans outstanding under the 2029 term loan facility.
Paragraph 83 · 37% changed
10-K Feb 20, 2025(d)Our Revolving Credit Facility contains two six-month extension options subject to certain conditions, including the payment of an extension fee equal to 0.0625% of the revolving commitments.
10-K Feb 19, 2026
(b)Our 2028 Unsecured Term Loan contains two twelve-month extension options subject to certain conditions, including the payment of an extension fee equal to 0.125% of the aggregate principal amount of the loans outstanding under the 2028 term loan facility.
Paragraph 84 · 37% changed
10-K Feb 20, 2025(d)Our Revolving Credit Facility contains two six-month extension options subject to certain conditions, including the payment of an extension fee equal to 0.0625% of the revolving commitments.
10-K Feb 19, 2026
(c)Our 2029 Unsecured Term Loan contains two twelve-month extension options subject to certain conditions, including the payment of an extension fee equal to 0.10% of the aggregate principal amount of the loans outstanding under the 2029 term loan facility.
Paragraph 16 · 35% changed
10-K Feb 20, 2025(a)Due to the nature of (1) transitional capital representing a contractual yield on invested capital, and (2) build-to-suit developments not generating revenue during construction, these are excluded from the calculation of total cash capitalization rates, weighted average lease terms, and weighted average rent increases.
10-K Feb 19, 2026
(a)Transitional capital, which represents a contractual yield on invested capital, and build-to-suit developments, which do not generate revenue until stabilization, are excluded from the calculations of total cash capitalization, weighted average lease terms, and weighted average rent increases.
Paragraph 29 · 35% changed
10-K Feb 20, 2025
We anticipate that we will continue to incur debt to fund future investment activity, which will increase the amount of interest expense we incur. In addition, although we attempt to limit our total floating-rate debt exposure, changes in the interest rate environment could either increase or decrease our weighted average interest rate in the future. As of December 31, 2024, 97.2% of our $1.9 billion of debt is fixed through fixed rates and $939.5 million of interest rate swap notional. As interest rate swaps mature, we will be subject to interest rate risk from changes in rates on our floating-rate debt to the extent we do not enter into new interest rate swaps. Any changes to our debt structure or debt financing associated with property investments, could materially influence our operating results depending on the terms of any such debt. Our current investment grade credit ratings are ‘BBB’ from S&P Global Ratings (“S&P”) and ‘Baa2’ from Moody’s Investors Service (“Moody’s”), which allow us to take advantage of the lower cost of debt. However, a downgrade in our credit rating, or interest rate change due to governmental monetary and tax policies, domestic and international economic and political conditions, or other factors beyond our control, could also increase the amount of interest we pay under our debt agreements.
10-K Feb 19, 2026
We anticipate that we will continue to incur debt to fund future investment activity, which will increase the amount of interest expense we incur. In addition, although we attempt to limit our total floating-rate debt exposure, changes in the interest rate environment could either increase or decrease our weighted average interest rate in the future. As of December 31, 2025, 87.2% of our $2.5 billion of debt is fixed through fixed rates and $943.0 million of interest rate swap notional. As interest rate swaps mature, we will be subject to interest rate risk from changes in rates on our floating-rate
A paragraph is matched with the one last year that shares the most of its words; under half in common makes it new. The paragraphs shown are the 8 reworded the most in each section.
The paragraph that changed most in each section
The redline
Marked against last year's 10-K: cut words struck through, new words highlighted.
Risk Factors218 words changed in this paragraph; it is 48% similar to last year's version.
Because each of Trident BRE Holdings I, Inc. and Trident BRE Holdings II, Inc. (the “Blocker Corps”) were taxable as a non-REIT C corporation and we acquired their appreciated assets in connection with the Company’s internalization in transactions (the “Blocker Corp Mergers”) in which the adjusted tax basis of the assets in our hands was determined by reference to the adjusted tax basis of the assets in the hands of each of the Blocker Corps prior to the Blocker Corp Mergers, we will be subject to corporate income tax on the “built-in gain” with respect to the Blocker Corps’ assets at the time of the Blocker Corp Mergers if we dispose of those assets in a taxable transaction within five years following the Blocker Corp Mergers. This built-in gain is measured by the difference between the value of the Blocker Corps’ assets at the time of the Blocker Corp Mergers and the adjusted basis in those assets. We estimate this built-in gain to be approximately $56.4 million. The assets of the Blocker Corps we acquired in the Blocker Corp Mergers are the Blocker Corps’ interests in BRE. When BRE merged into the OP in a tax-deferred transaction and the Blocker Corps received OP Units, the built-in gain associated with the Blocker Corps’ assets became represented as part of an intangible asset on our balance sheet. The disposition of that intangible asset in a taxable transaction within five years following the Blocker Corp Mergers could trigger a corporate income tax on that built-in gain. The most likely transaction in which that intangible asset is disposed of would be a sale of the OP (or our interest in the OP) in a taxable transaction. Thus, if the OP (or our interest in the OP) is sold in a taxable transaction within five years following the Blocker Corp Mergers, we could incur a corporate income tax on approximately $56.4 million of built-in gain.
Source: Item 1A, 10-K 0001424182-26-000012 vs Item 1A, 10-K 0000950170-25-024123
Legal Proceedings150 words changed in this paragraph; it is 50% similar to last year's version.
The Company is a party to two separate tax protection agreements with the contributing members of two distinct UPREIT transactions and a third tax protection agreement entered into in connection with the Company’s internalization. The tax protection agreements require the Company to indemnify the beneficiaries in the event of a sale, exchange, transfer, or other disposal of the contributed property, and in the case of the tax protection agreement entered into in connection with the Company’s internalization, the entire Company, in a taxable transaction that would cause such beneficiaries to recognize a gain that is protected under the agreements, subject to certain exceptions. The Company is required to allocate an amount of nonrecourse liabilities to each beneficiary that is at least equal to the minimum liability amount, as contained in the agreements. The minimum liability amount and the associated allocation of nonrecourse liabilities are calculated in accordance with applicable tax regulations, are completed at the OP level, and are not probable. Therefore, there is no impact to the Consolidated Financial Statements. Based on values as of December 31, 2024, taxable sales of the applicable properties would trigger liability under the agreements of approximately $20.4 million. Based on information available, the Company does not believe that the events resulting in damages as detailed above have occurred or are likely to occur in the foreseeable future.
Source: Item 3, via Note 17 – Commitments and Contingencies, 10-K 0001424182-26-000012 vs Item 3, via Note 17 – Commitments and Contingencies, 10-K 0000950170-25-024123
MD&A140 words changed in this paragraph; it is 62% similar to last year's version.
Our equity capital is primarily provided through our at-the-market common equity offering program (“ATM Program”), as well as follow-on equity offerings. During May 2024, we replaced our prior ATM Program with a new ATM Program with the same aggregate gross sales price of up to $400.0 million. Under the terms of our ATM Program we may, from time to time, publicly offer and sell shares of our common stock having an aggregate gross sales price of up to $400.0 million. The ATM Program provides for forward sale agreements, which enable us to set the price of shares upon pricing the offering, while delaying the issuance of shares and the receipt of the net proceeds. During the year ended December 31, 2024, in connection with forward sales agreements provided for under the ATM Program, we sold 2,187,700 shares of common stock at a weighted average price of $18.29 per share, subject to certain adjustments. We expect to settle the outstanding shares of these forward sales agreements before their maturities in August and September 2025. Our estimated net proceeds of these forward sale agreements, assuming physical settlement for cash as of December 31, 2024, is approximately $38.5 million. We have not settled any part of these forward sales agreements as of December 31, 2024. After considering the shares sold subject to forward sale agreements, we have $360.0 $348.6 million of capacity remaining under the ATM Program as of December 31, 2024. There were no shares issued under the ATM Program for the year ended December 31, 2023. 2025.
Source: Item 7, 10-K 0001424182-26-000012 vs Item 7, 10-K 0000950170-25-024123
Accounting Policies128 words changed in this paragraph; it is 32% similar to last year's version.
During the year ended December 31, 2023, 2024, the Company recognized an impairment charge of $26.4 million on a healthcare property due to $49.0 million, resulting from changes in the tenant’s ability to perform under the lease agreement, leading to a change in management’s Company’s long-term hold strategy and desire with respect to the individual properties. The 2024 impairments primarily relate to the Company’s decision to sell in clinically-oriented healthcare properties and include $41.7 million on 16 clinical healthcare properties, which were based on actual or estimated sales prices of the near term. The fair value measurement was determined using individual properties. Of these properties, 11 were sold as part of a range portfolio with a gain of significant unobservable inputs, including a third-party appraisal, broker market information, and recent comparable vacant sales transactions. $59.1 million, excluding any impairment. The remaining impairments recognized during the year ended December 31, 2023 2024 were immaterial. not material.
Source: Item 8, Note 2 – Summary of Significant Accounting Policies, 10-K 0001424182-26-000012 vs Item 8, Note 2 – Summary of Significant Accounting Policies, 10-K 0000950170-25-024123
Sentences and paragraphs added, removed or reworded
Every change, by type
Sentences and paragraphs of BNL's Risk Factors and MD&A, 10-K Feb 19, 2026 against 10-K Feb 20, 2025. Each links to the text at sec.gov.
Quiet changes are sentences kept from last year with one to four words changed, at least one of them a hedge, a modal or a qualifier (may, could, will, not, significant, material…). A year or date rolling forward is not counted.
The full word list
adverse, adversely, all, although, anticipate, anticipates, any, approximately, believe, believes, can, cannot, certain, could, expect, expects, generally, however, if, intend, intends, largely, likely, many, material, materially, may, might, most, must, never, no, not, possible, primarily, probable, should, significant, significantly, some, substantial, substantially, unlikely, will, would
AddedRisk Factors
Our portfolio consists primarily of single-tenant net leased properties and we are dependent on our tenants for substantially all of our revenue. As a result, our success depends on the financial stability of our tenants. The ability of our tenants to meet their obligations to us, including their obligations to pay rent, maintain certain insurance coverage, pay real estate
Read it in 10-K Feb 19, 2026 at sec.gov
AddedRisk Factors
Our business may be adversely affected by changes in U.S. trade policy, including the imposition of tariffs and resulting effects.
Read it in 10-K Feb 19, 2026 at sec.gov
AddedRisk Factors
Changes in U.S. trade policy, including the imposition of tariffs on certain foreign goods or an increase in existing tariffs, renegotiating or terminating certain existing bilateral or multi-lateral trade agreements, and the imposition of additional trade restrictions, may have an adverse impact on our business and results of operations resulting from potential negative effects on the operations of our tenants and/or our ability to successfully execute on build-to-suit development projects and expansion opportunities. While these developments should not directly affect the Company because of the nature of our operations, they could negatively impact the operations of our tenants to the extent they import or export goods in connection with the operation of their respective businesses, which could in turn negatively impact the ability of our tenants to fulfill their contractual obligations pursuant to our leases, including the payment of rent. Further, if, as a result of existing or future tariffs, current or future tenants or development partners are forced to increase prices of their goods or services, incur additional expenses for inputs or construction materials, modify business operations, or forego business opportunities, it may lead to the delay, abandonment, or cancellation of our existing and future build-to-suit development projects and expansion opportunities, which may adversely affect our results of operations.
Read it in 10-K Feb 19, 2026 at sec.gov
AddedRisk Factors
New technologies also continue to develop, including tools that harness generative artificial intelligence and other machine learning techniques (collectively, “AI”). AI is developing at a rapid pace and becoming more accessible. As a result, the use of such new technologies by the Company and/or the Company’s third-party service providers can present additional known and unknown risks, including, among others, the risk that confidential information may be stolen, misappropriated, or disclosed and the risk that the Company and/or its third-party service providers may rely on incorrect, unclear, or biased outputs generated by such evolving technologies, any of which could have an adverse impact on the Company and its business.
Read it in 10-K Feb 19, 2026 at sec.gov
AddedRisk Factors
tenants’ reported financial condition or results of operations and affect their preferences regarding leasing real estate as well as their ability to provide accurate or complete financial information to us.
Read it in 10-K Feb 19, 2026 at sec.gov
AddedRisk Factors
Additionally, a portion of our indebtedness is at variable rates which are based on the Canadian Overnight Repo Rate Average (“CORRA”), as a result of the transition from the Canadian Dollar Offered Rate, or CDOR, which ceased publication on June 28, 2024. CORRA has a limited history as a reference rate, and changes in this rate have, on occasion, been more volatile than changes in other benchmark or market rates. The liquidity of the CORRA loan markets could result in higher borrowing costs for us. There could be unanticipated difficulties, disruptions or methodological or other changes with the calculation and publication of these rates, which in turn could trigger another benchmark transition or otherwise cause a reliance on an alternate base rate. This could also result in increased borrowing costs for us and thereby adversely affect our financial condition and earnings.
Read it in 10-K Feb 19, 2026 at sec.gov
AddedRisk Factors
Further, net lease REITs must be able to deploy capital. If we cannot access the capital markets upon favorable terms or at all, or raise capital from alternative sources to the public equity markets, we may not be able to acquire investments upon favorable terms or at all and may be required to liquidate investments, including investments that have not yet realized maximum return, which could result in adverse tax consequences and/or adversely affect our ability to meet cash flow and other operational needs. Turmoil in the capital markets could lead to decreased consumer confidence and widespread reduction of business activity, adversely impacting our tenants and us.
Read it in 10-K Feb 19, 2026 at sec.gov
RemovedRisk Factors
Show the other 52
RemovedRisk Factors
RemovedRisk Factors
RemovedRisk Factors
RemovedRisk Factors
RemovedRisk Factors
RemovedRisk Factors
RewordedRisk Factors
RewordedRisk Factors
The known or potential presence of hazardous substances on a property may adversely affect our ability to sell, lease, or improve the property, or to borrow using the property as collateral. collateral, and we may incur substantial remediation costs or third-party liability claims In addition, environmental laws may create liens on contaminated properties in favor of the government for damages and costs it incurs to address such contamination.
Read it in 10-K Feb 19, 2026 at sec.gov
RewordedRisk Factors
(the “Blocker Corps”) were taxable as a non-REIT C corporation and we acquired their appreciated assets in connection with the Company’s internalization in transactions (the “Blocker Corp Mergers”) in which the adjusted tax basis of the assets in our hands was determined by reference to the adjusted tax basis of the assets in the hands of each of the Blocker Corps prior to the Blocker Corp Mergers, we will be subject to corporate income tax on the “built-in gain” with respect to the Blocker Corps’ assets at the time of the Blocker Corp Mergers if we dispose of those assets in a taxable transaction within five years following the Blocker Corp Mergers.
Read it in 10-K Feb 19, 2026 at sec.gov
RewordedRisk Factors
Any income from a hedging transaction that we enter into to manage the risk of interest rate changes with respect to borrowings made or to be made to acquire or carry real estate assets, or from certain terminations of such hedging positions, does not constitute “gross income” for purposes of the 75% or 95% gross income tests that apply to REITs, provided that certain identification requirements are met.
Read it in 10-K Feb 19, 2026 at sec.gov
RewordedRisk Factors
RewordedRisk Factors
As a result, a tenant may fail to make rental payments when due, decline to extend a lease upon its expiration, fail to maintain the property or otherwise pay its required expenses, including real estate taxes, under the terms of a lease, become insolvent, or declare bankruptcy.
Read it in 10-K Feb 19, 2026 at sec.gov
RewordedRisk Factors
RewordedRisk Factors
Certain uses of some properties may have a heightened risk of environmental liability because of the hazardous materials used in performing services on those properties, such as industrial properties or businesses using petroleum products, paint, machine solvents, and other hazardous materials.
Read it in 10-K Feb 19, 2026 at sec.gov
RewordedRisk Factors
The departure of any member of our executive management team, or our inability to attract and retain highly qualified personnel, could adversely affect our business, diminish our investment opportunities, and weaken our relationships with lenders, business partners, existing and prospective tenants, and industry personnel, which could materially and adversely affect us.
Read it in 10-K Feb 19, 2026 at sec.gov
RewordedRisk Factors
RewordedRisk Factors
As of December 31, 2024, 2025, master leases contributed to approximately 69.1% 64.9% of our ABR associated with multi-site tenants (394 (379 of 656 658 multi-site tenant properties), and approximately 41.4% 38.6% of our overall ABR (394 (379 of our 765 properties). 771 properties)].
Read it in 10-K Feb 19, 2026 at sec.gov
RewordedRisk Factors
To evaluate tenant credit risk, we utilize a third-party model, S&P Capital IQ, tenant’s public credit rating if available and credit-assessment tools to help us determine a tenant’s implied credit rating when a public rating is not available.
Read it in 10-K Feb 19, 2026 at sec.gov
Quiet changesRisk Factors
Our methods, however, methods may not adequately assess the risk of an investment and, if our assessment of credit quality proves to be inaccurate, we may be subject to defaults and investors may view our cash flows as less stable.
Read it in 10-K Feb 19, 2026 at sec.gov
AddedMD&A
(e)Development represents our common and preferred equity investments in a consolidated joint venture, and excludes amounts attributed to non-controlling interest holders.
Read it in 10-K Feb 19, 2026 at sec.gov
AddedMD&A
Although contractual risk‑mitigation provisions and budget contingencies help reduce our exposure to inflation on in-process build‑to‑suit developments, our construction projects remain subject to potential cost overruns that could increase total project costs and adversely affect expected investment yields. To further manage these risks, we utilize a number of protective measures in our build-to-suit arrangements, including contingencies, allowances, guaranteed maximum price contracts and change orders with Tenants. We generally seek to lock in material and labor pricing through guaranteed maximum price contracts, which shift a portion of the inflationary cost risk to our general contractors and development partners. Where appropriate, our agreements permit us to pass certain cost increases thru to tenants or to change project scopes to minimize cost impacts. These strategies help mitigate the potential impact of inflation on construction costs; however, sudden, significant or sustained inflationary pressures could still adversely affect our development yields and returns if such costs are not allowed to be passed through to the general contractor, developer or tenant or to be absorbed by contingency in the project budget.
Read it in 10-K Feb 19, 2026 at sec.gov
AddedMD&A
upon lease expiration, changes in our view or strategy relative to a tenant’s business or industry, or changes in our long-term hold strategies, could each be indicative of an impairment triggering event. For the year ended December 31, 2025, we recognized $39.7 million of impairment due to a change in our long-term hold strategy for 19 properties.
Read it in 10-K Feb 19, 2026 at sec.gov
AddedMD&A
The increase in Lease revenues, net was primarily attributable to increased contractual rents related to rent escalations and growth in our real estate portfolio, specifically through recognizing a full year of rental revenue for all property acquisitions, revenue generating capital expenditures, and development stabilizations made in 2024. This was partially offset by the reductions of revenues associated with property dispositions. During the year ended December 31, 2025, we invested $438.2 million in new property acquisitions and revenue generating capital expenditures at a weighted average cash capitalization rate of 7.0%, and reached stabilization on a $54.1 million industrial build-to-suit development at a cash capitalization rate of 7.5%. During the year ended December 31, 2024, we invested $237.3 million in new property acquisitions and revenue generating capital expenditures at a weighted average initial cash capitalization rate of 7.3%, and reached stabilization on a $201.0 million build-to-suit development at a cash capitalization rate of 7.2%.
Read it in 10-K Feb 19, 2026 at sec.gov
AddedMD&A
The increase in interest expense during the year ended December 31, 2025 was primarily due to the termination of interest rate swap agreements with an aggregate termination value of $6.7 million, which resulted in $6.1 million of accumulated losses held in Other comprehensive income to Interest expense. Additionally, interest expense increased due to an increase in total borrowings on our variable-rate Revolving Credit Facility, an additional $100.0 million of term debt outstanding, and the completion of our $350.0 million 5.00% senior unsecured notes, the proceeds of which were used to fund acquisitions and paydown the Revolving Credit Facility during 2025.
Read it in 10-K Feb 19, 2026 at sec.gov
AddedMD&A
an extension fee equal to 0.10% of the aggregate principal amount of the loans outstanding under the 2029 term loan facility.
Read it in 10-K Feb 19, 2026 at sec.gov
AddedMD&A
(g)Represents our contractual lease obligations as a lessee, primarily including our corporate headquarters and ground leases at our rental properties or properties under development. Our tenants are responsible for paying the rent under these ground leases at our stabilized assets. In the event our tenant fails to pay the ground lease rent, we are primarily responsible.
Read it in 10-K Feb 19, 2026 at sec.gov
AddedMD&A
that AFFO is a useful supplemental measure for investors to consider because it will help them to better assess our operating performance without the distortions created by non-cash revenues or expenses.
Read it in 10-K Feb 19, 2026 at sec.gov
RemovedMD&A
RemovedMD&A
RemovedMD&A
RemovedMD&A
RemovedMD&A
RemovedMD&A
RemovedMD&A
RemovedMD&A
RemovedMD&A
RemovedMD&A
RemovedMD&A
RemovedMD&A
RewordedMD&A
Year ended Ended December 31, Increase/(Decrease) (in thousands) 2025 2024 2023 $ % Contractual rental amounts billed for operating leases $ 408,794 $ 388,074 $ 388,073 $ 1 —% 20,720 5.3 Adjustment to recognize contractual operating lease 22,163 27,154 (4,991) (18.4 )% billings on a straight-line basis 22,269 22,163 106 0.5 Net write-offs of accrued rental income (4,086) (2,556) (4,266) 1,710 40.1% (1,530) 59.9 Variable rental amount amounts earned 3,340 2,999 2,277 722 31.7% 341 11.4 Earned income from direct financing leases 2,707 2,748 2,752 (4) (0.1 )% (41) (1.5 Interest income from sales-type leases 828 58 58 — —% 770 1327.6 Operating expenses billed to tenants 20,629 20,693 20,363 330 1.6% (64) (0.3 Other income from real estate transactions (a) 574 2,039 7,414 (5,375) (72.5 )% (1,465) (71.8 Adjustment to revenue recognized for uncollectible (4,418) (937) (3,481) > (100.0) % rental amounts billed, net (917) (4,418) 3,501 (79.2 Total Lease lease revenues, net $ 454,138 $ 431,800 $ 442,888 $ (11,088) (2.5 )% 22,338 5.2
Read it in 10-K Feb 19, 2026 at sec.gov
RewordedMD&A
For the Three Months Ended December 31, (in thousands) 2025 2024 2023 2022 Net income $ 35,028 $ 27,607 $ 6,797 $ 36,773 Depreciation and amortization 41,768 42,987 39,278 45,606 Interest expense 25,051 19,565 18,972 23,773 Income taxes 392 527 (268) 105 EBITDA $ 102,239 $ 90,686 $ 64,779 $ 106,257 Provision for impairment of investment in rental properties 4,667 17,690 29,801 — Gain on sale of real estate (8,371) (8,197) (6,270) (10,625) EBITDAre $ 98,535 $ 100,179 $ 88,310 $ 95,632 Adjustment for current quarter acquisition activity (a) 1,821 28 153 1,283 Adjustment for current quarter disposition activity (b) (286) (11) (156) (440) Adjustment to exclude non-recurring expenses (income) (c) 2,515 348 128 — Adjustment to exclude net write-offs of accrued rental income 1,103 120 4,161 — Adjustment to exclude gain on insurance recoveries — — (341) Adjustment to exclude realized/unrealized foreign exchange loss (gain) loss 1,282 (4,699) 1,453 796 Adjustment to exclude cost of debt extinguishments — — 77 Adjustment to exclude other income from real estate transactions (d) (392) (1,183) — (1,678) Adjusted EBITDAre $ 104,578 $ 94,782 $ 94,049 $ 95,329 Estimated revenues from developments (e) 2,867 334 — — Pro Forma Adjusted EBITDAre $ 107,445 $ 95,116 $ 94,049 $ 95,329 Annualized EBITDAre $ 394,140 $ 400,716 $ 353,240 $ 382,528 Annualized Adjusted EBITDAre $ 418,312 $ 379,128 $ 376,196 $ 381,316 Pro Forma Annualized Adjusted EBITDAre $ 429,780 $ 380,464 $ 376,196 $ 381,316
Read it in 10-K Feb 19, 2026 at sec.gov
RewordedMD&A
For the Year Ended December 31, (in thousands, except per share data) 2025 2024 2023 2022 Net income $168,989 $163,312 $129,475 $ 99,416 $ 168,989 $ 163,312 Real property depreciation and amortization 163,752 155,844 158,346 154,673 Gain on sale of real estate (12,601) (73,153) (54,310) (15,953) Provision for impairment on investment in rental properties 39,734 49,001 31,274 5,535 FFO $300,681 $298,622 $273,730 $ 290,301 $ 300,681 $ 298,622 Net write-offs of accrued rental income 4,089 2,676 4,458 1,326 Other non-core income from real estate transactions (a) (348) (2,070) (7,500) (2,469) Gain on insurance recoveries — — (341) Cost of debt extinguishment 166 — 3 308 Severance and employee transition costs 55 385 1,622 401 Other (income) expenses (b) 6,252 (6,201) 1,678 (5,690) Core FFO $295,471 $298,883 $267,265 $ 300,515 $ 295,471 $ 298,883 Straight-line rent adjustment (21,591) (21,652) (26,736) (21,900) Adjustment to provision for credit losses (13) (17) (10) (5) Amortization of debt issuance costs 5,488 3,932 3,938 3,692 Amortization of net mortgage premiums — — (78) (104) Non-capitalized transaction costs 541 951 — — Loss on interest rate swaps and other non-cash interest expense 6,139 209 1,884 2,514 Amortization of lease intangibles (c) (4,470) (4,413) (5,846) (4,809) Stock-based compensation 9,597 7,355 5,972 5,316 Deferred taxes 75 155 (282) 204 AFFO $281,991 $277,725 $252,173 $ 296,281 $ 281,991 $ 277,725
Read it in 10-K Feb 19, 2026 at sec.gov
RewordedMD&A
(in thousands, except interest rates) Outstanding Interest Maturity Balance Rate Date Revolving Credit Facility $ 93,014 Applicable $266,036 applicable reference rate + 0.85% (a) Mar. 2026 2029 (d) Unsecured term loans: 2026 Unsecured Term Loan 400,000 one-month adjusted SOFR + 1.00% (b) Feb. 2026 2027 Unsecured Term Loan 200,000 daily simple adjusted SOFR + 0.95% (b) Aug. 2027 2028 Unsecured Term Loan 500,000 one-month SOFR + 0.95% (c) Aug. 2027 Mar. 2028 (e) 2029 Unsecured Term Loan 300,000 daily simple adjusted SOFR + 1.25% (c) Aug. 0.95% (b) Feb. 2029 (f) Total unsecured term loans 900,000 1,000,000 Unamortized debt issuance costs, net (2,799) (5,781) Total unsecured term loans, net 897,201 994,219 Senior unsecured notes: 2027 Senior Unsecured Notes - Series A 150,000 4.84% Apr. 2027 2028 Senior Unsecured Notes - Series B 225,000 5.09% Jul. 2028 2030 Senior Unsecured Notes - Series C 100,000 5.19% Jul. 2030 2031 Senior Unsecured Public Notes 375,000 2.60% Sep. 2031 2032 Senior Unsecured Public Notes 350,000 5.00% Nov. 2032 Total senior unsecured notes 850,000 1,200,000 Unamortized debt issuance costs and (3,936) original issuance discount, discounts, net (9,262) Total senior unsecured notes, net 846,064 1,190,738 Total unsecured debt $ 1,836,279 $2,450,993
Read it in 10-K Feb 19, 2026 at sec.gov
RewordedMD&A
The decrease increase in depreciation and amortization for the year ended December 31, 2024 2025 was primarily due to an increase in net investment activity during 2025, as well as properties sold acquired and developments stabilized in the previous year not having a full year of depreciation in the current year, offset by a full year’s worth of depreciation from property investments made in the previous year as well as partial depreciation from property investments made in the current year.
Read it in 10-K Feb 19, 2026 at sec.gov
RewordedMD&A
The increase decrease in property and operating expense expenses for the year ended December 31, 2024 2025 was primarily due to a $2.9 million increase decrease in non-reimbursable property expenses related to a decrease in occupancy, for two properties that were re-leased and sold at the beginning of which $1.7 million related to real estate taxes. 2025 and end of 2024, respectively.
Read it in 10-K Feb 19, 2026 at sec.gov
RewordedMD&A
The decrease increase in net cash used in provided by financing activities during the year ended December 31, 2024 2025 as compared to the year ended December 31, 2023, 2024, mainly reflects an increase in net borrowings on the proceeds from unsecured term loans, senior unsecured notes, and Revolving Credit Facility and increased distributions paid to shareholders in 2024 compared to 2023. Facility.
Read it in 10-K Feb 19, 2026 at sec.gov
RewordedMD&A
Year ended December 31, Increase/(Decrease) (in thousands) 2025 2024 2023 $ % Operating expenses Depreciation and amortization $ 164,086 $ 156,179 $ 158,626 $ (2,447) (1.5 )% 7,907 5.1 Property and operating expense 22,971 24,741 22,576 2,165 9.6% (1,770) (7.2 General and administrative 38,883 37,986 39,425 (1,439) (3.6 )% 897 2.4 Provision for impairment of investment in rental properties 39,734 49,001 31,274 17,727 56.7% (9,267) (18.9 Total operating expenses $ 265,674 $ 267,907 $ 251,901 $ 16,006 6.4% (2,233) (0.8
Read it in 10-K Feb 19, 2026 at sec.gov
RewordedMD&A
Indications of a tenant’s inability to continue as a going concern, plans to vacate the property upon lease expiration, changes in our view or strategy relative to a tenant’s business or industry, or changes in our long-term hold strategies, could each be indicative of an impairment triggering event.
Read it in 10-K Feb 19, 2026 at sec.gov
RewordedMD&A
RewordedMD&A
(b)Amount includes $3.7 million, ($6.2) million, and $1.7 million, and ($5.6) million of unrealized foreign exchange (gain) loss for the years ended December 31, 2025, 2024, and 2023, and 2022, respectively, primarily associated with our Canadian dollar denominated Revolver Credit Facility borrowings. borrowings, and a $2.5 million write-off of a non-real estate note receivable during the year ended December, 31, 2025.
Read it in 10-K Feb 19, 2026 at sec.gov
RewordedMD&A
As of December 31, (in thousands) 2025 2024 2023 Debt Revolving Credit Facility $ 266,036 $ 93,014 $ 90,434 Unsecured term loans, net 994,219 897,201 895,947 Senior unsecured notes, net 1,190,738 846,064 845,309 Mortgages, net 56,689 76,846 79,068 Debt issuance costs 15,072 6,802 8,848 Gross Debt 2,522,754 1,919,927 1,919,606 Cash and cash equivalents (30,540) (14,845) (19,494) Restricted cash (3,102) (1,148) (1,138) Net Debt $ 2,489,112 $ 1,903,934 $ 1,898,974 Estimated net proceeds from forward equity agreements (a) (10,964) (38,514) — Pro Forma Net Debt $ 2,478,148 $ 1,865,420 $ 1,898,974 Leverage Ratios:
Read it in 10-K Feb 19, 2026 at sec.gov
Quiet changesMD&A
The as-if-vacant "if vacant" value is then allocated to land and land improvements, buildings, and equipment based on comparable sales and other relevant information with respect to the property, as estimated by management.
Read it in 10-K Feb 19, 2026 at sec.gov
Sources
The two latest 10-Ks on EDGAR, section by section. Each change links to the text at sec.gov.
Also
New risk factors: paragraphs with nothing like them last year, quoted in full.
Work with it
Excel workbook · CSV. Google Sheet that stays up to date: paste =IMPORTDATA("https://tickdelta.com/company/BNL/export.csv") into a cell.