Screener / SEC EDGAR /CIK 0001915657 /10-K filed Feb 27, 2026, compared with Feb 20, 2025 /Numbers from the XBRL of the 10-Ks
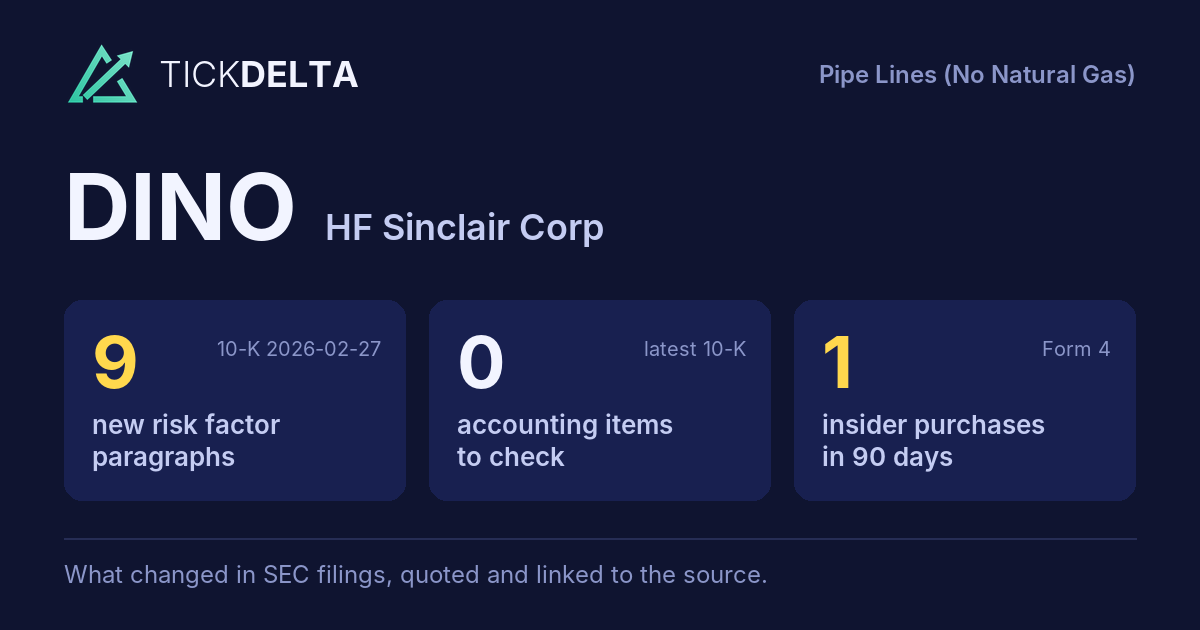
NYSE Industrials · Pipe Lines (No Natural Gas)

HF Sinclair Corp DINO

Compare with peers Embed
SEC comment letters, last 20 years

2 reviews of DINO's filings by SEC staff

UPLOAD and CORRESP
Reviews 2 latest letter May 22, 2024
Questions asked 6 each answered in the company's own letter
No closing letter 1 reviews without a letter saying the staff completed it

When the SEC's staff reviews a filing, it writes to the company with numbered questions, and the company answers each one in a letter. SEC publishes the exchange once the review is over, at least 20 business days later. A question is not an accusation; most reviews end with the company adding detail to its next filing.

How the reviews went

Every review on EDGAR, from the first staff letter to the letter that closes it

  1. 1. Staff letters 3 UPLOAD
  2. 2. Questions in them 6 numbered comments
  3. 3. Company replies 3 CORRESP
  4. 4. Reviews closed 1 of 2 closing letter

Half the closed reviews took 71 days or less from the first letter to the closing letter.

Form S-4

2024-05-22 to 2024-08-02 · 1 question · 1 letter from the SEC, 1 from the company
No closing letter
General
SEC asked
We note that there are outstanding comments on your Form 10-K for the fiscal year ended December 31, 2023. We will not be in a position to accelerate the effectiveness of your registration statement until all comments on this filing are resolved.
DINO answered
The Issuer is registering the Exchange Offers in reliance on the Staff’s position and representations set forth in Shearman &

Sterling, SEC No-Action Letter (available July 2, 1993), Morgan Stanley & Co., Inc., SEC No-Action Letter (available June 5, 1991), and Exxon Capital

Holdings Corp., SEC No-Action Letter (available May 13, 1988) (together, the “No-Action Letters”) and Question 125.13 of the Staff’s

Securities Act Forms Compliance and Disclosure Interpretations.
Read in the reply

Form 10-K

2024-05-15 to 2024-07-25 · 5 questions · 2 letters from the SEC, 2 from the company
Review closed 2024-07-25
Non-GAAP measuresSegmentsInventory
Form 10-K for Fiscal Year ended December 31, 2023 · Reconciliations to Amounts Reported Under Generally Accepted Accounting Principles, page 76
SEC asked (1)
We note your reconciliation of the following non-GAAP presentations exclude the effects of "lower of cost or market inventory valuation adjustments" in the Form 10-K and in the Press Release filed under Form 8-K: • Adjusted EBITDA, • Refinery Segment Gross Margin and Net Operating Margin per produced barrel sold, and • Renewable Segment Gross Margin and Net Operating Margin per produced gallon sold.
Rest of the question

It appears these inventory-related adjustments substitute individually tailored recognition and measurement methods for those of GAAP. While it may be appropriate to highlight these items in your discussion of operating results, it is unclear whether these adjustments that have the effect of changing the recognition and measurement principles required to be applied in accordance with GAAP are appropriate reconciling items for non-GAAP performance measures. Please revise or explain to us the basis for excluding lower of cost or market inventory valuation adjustments in your presentation of these non-GAAP measures. Refer to Question 100.04 of the Non-GAAP Measures Compliance and Disclosure Interpretations. We note similar issues in your Form 10-Q for the quarterly period ended March 31, 2024.

DINO answered
The Corporation respectfully acknowledges the Staff’s comment and advises the Staff that it does not believe the exclusion of lower of cost or market inventory valuation adjustments from its non-GAAP measures of Adjusted EBITDA, Refinery gross margin and Net operating margin per produced barrel sold and Renewables gross margin and Net operating margin per produced gallon sold represent individually tailored recognition and measurement methods substituted for those of GAAP.
Rest of the answer

The lower of cost or market inventory valuation adjustments are recognized and measured in accordance with GAAP, and appear on the Corporation’s income statements as a separate line item component of the Corporation’s operating costs and expenses (similar to depreciation and amortization). See, for example, the Corporation’s Consolidated Statements of Income appearing on page 85 of the Form 10-K.

The Corporation’s lower of cost or market inventory valuation adjustments relate to its refining and renewable inventories, which are accounted for using the last-in, first-out inventory (“LIFO”) valuation methodology. The lower of cost or market inventory valuation adjustments are unrealized valuation adjustments applied to inventory volumes remaining in inventory at the end of the period, recorded to reflect the lower of cost or market values based on market conditions and prices at that time. As this inventory is still on the Corporation’s balance sheet at period end, the related non-cash costs incurred in the period through the lower of cost or market inventory valuation adjustment relate to costs that will be realized through the sale of inventory in future periods, and do not reflect costs related to the sale of products in the current period. We believe this adjustment is beneficial to our investors by providing them with a comparable view of our performance in the period presented unaffected by the unrealized and non-cash valuation adjustment.

The Corporation has considered Question 100.04 of the Division of Corporation Finance Compliance and Disclosure Interpretations and respectfully advises the Staff that the lower of cost or market inventory valuation adjustments represent valuation adjustments, measured and recognized in accordance with GAAP, to assets that are on the Corporation’s balance sheet at period end that will be associated with future sales, whereas the non-GAAP measures reflect the realized cost associated with inventory sold in the current period. The non-GAAP measures are designed to attribute the realized cost to the current period revenue transactions, and that realized cost is not based on an individually tailored measurement method. Additionally, participants in our industry hold inventory at varying historical levels and layers of pricing under the LIFO valuation methodology, and this adjustment has historically been standard practice in our industry in order to provide management and others the ability to compare our current period performance to that of other companies in our industry. The adjustment also benefits our investors by providing results that are in alignment with publicly available “crack spread” information, which is the spread between market prices for refined products and market prices for crude oil. The U.S. Energy

Information Administration provides crack spread data used by investors to evaluate refinery profit margins.

Therefore, the Corporation believes that adjusting for items of this nature does not contradict Rule 100(b) of Regulation G and helps investors better understand the Corporation’s operating performance in the period. The Corporation does not believe these measures are misleading to investors, and notes that similar adjustments are made by public peer companies throughout our industry.

Going forward, the Corporation will revise its description of the foregoing non-GAAP measures to clarify the nature of the inventory valuation adjustments and underlying inventory valuation methodology. Please see our response to Comment 2B below for an example of our proposed future disclosure.

Read in the reply
In its next report

First report after the company's reply of Jun 6, 2024: 10-Q filed Aug 1, 2024 ↗, against the 10-Q filed May 8, 2024 ↗.

Tickdelta does not hold the text of both reports, so they are not compared here.

Form 10-K for Fiscal Year ended December 31, 2023 · Reconciliations to Amounts Reported Under Generally Accepted Accounting Principles, page 76
SEC asked (2)
We note you present here non-GAAP measures Refinery segment gross margin and Net operating margin per produced barrel sold, Renewable segment gross margin and Net operating margin per produced barrel sold and Marketing segment gross margin per gallon sold.
Rest of the question

Please revise to address the following: • We note the titles of the above noted non-GAAP measures are the same as, or confusingly similar to, titles or descriptions used for GAAP financial measures. Please revise the titles or descriptions of non-GAAP measures here and throughout the filing to reflect their adjusted nature such as “Adjusted gross margin” or similar titles. Please refer to Item 10(e)(ii)(E) of Regulation S-K. • You present Refinery gross margin, Renewables gross margin, Marketing gross margin, Refinery net operating margin per produced barrel sold and Renewables net operating margin per produced barrel sold, without also presenting the most directly comparable GAAP measure. Please expand to include a presentation of the most directly comparable US GAAP measure and reconcile to non-GAAP measures presented as required by Item 10(e)(1)(i) of Regulation S-K and Question 102.10(a) of the Non-GAAP Financial Measures Compliance and Disclosure Interpretations. We also note similar issues in your Form 10-Q for the quarterly period ended March 31, 2024.

DINO answered
Response to

Comment 2A: In future filings, the Corporation will revise its descriptions of Refinery gross margin, Renewables gross margin and Marketing gross margin to “Adjusted refinery gross margin,” “Adjusted renewables gross margin” and “Adjusted marketing gross margin,” respectively, to help avoid confusion with the GAAP measure “gross margin.” The Corporation plans to describe Refining segment net operating margin and Renewable segment net operating margin as “Adjusted refinery gross margin, less operating expenses” and “Adjusted renewables gross margin, less operating expenses,”
Rest of the answer

respectively. Each of these non-GAAP measures may also be presented per produced barrel or per produced gallon. Please see the below revised descriptions and reconciliations as an example of these changes.

Response to Comment 2B: The Corporation respectfully acknowledges the

Staff’s comment. The Corporation considers segment gross margin as the most directly comparable GAAP measure for each of Refinery gross margin and Refining segment net operating margin per produced barrel sold, Renewables gross margin and

Renewables segment net operating margin per produced gallon sold, and Marketing gross margin per gallon sold. The Corporation has considered Item 10(e)(1)(i) of Regulation S-K and plans to revise its presentation of these financial measures going forward to clarify that the most directly comparable GAAP measure is segment gross margin and present its reconciliations of the newly renamed non-GAAP measures of:

•

Adjusted refinery gross margin and Adjusted refinery gross margin per produced barrel sold,

Adjusted refinery gross margin, less operating expenses, per produced barrel sold,

Adjusted renewables gross margin and Adjusted renewables gross margin, per produced gallon sold,

Adjusted renewables gross margin, less operating expenses per produced gallon sold, and

Adjusted marketing gross margin and Adjusted marketing gross margin per gallon sold to reconcile from segment gross margin and to present segment gross margin per produced barrel or gallon sold, beginning with our Form 10-Q for the quarterly period ending June 30, 2024.

Illustrations of our revised descriptions and reconciliations of these non-GAAP measures for the year ended December 31, 2023 are shown below. The revisions are marked with underlines to facilitate the Staff’s review. We have also revised the titles of these non-GAAP measures as described in Comment 2A above.

Reconciliations of refinery operating information (non-GAAP performance measures) to amounts reported under generally accepted accounting principles in financial statements.

RefineryAdjusted refinery gross margin and net operating margin are is a non-GAAP performance measures that are is used by our management and others to compare our refining performance to that of other companies in our industry. We believe these this margin measures are measure is helpful to investors in evaluating our refining performance on a relative and absolute basis, including against publicly available crack spread data. RefineryAdjusted refinery gross margin per produced barrel sold is total Refining segment revenues less total Refining segment cost of products sold, exclusive of gross margin plus lower of cost or market inventory valuation adjustments, depreciation and amortization and operating expenses, divided by sales volumes of produced refined products sold. Net operating margin per barrel sold is the difference between refinery gross margin and refinery operating expenses per produced barrel sold. These two margins do This margin measure does not include the non-cash effects of lower of cost or market inventory valuation adjustments and depreciation and amortization. Each of these component performance measures can be reconciled directly to our consolidated statements of income, which relate to volumes in inventory at the end of the period. Adjusted refinery gross margin is not a calculation provided for under US GAAP and should not be considered in isolation or as a substitute for Refining segment gross margin. The GAAP measure most directly comparable to Adjusted refinery gross margin is Refining segment gross margin. Other companies in our industry may not calculate these performance measures in the same manner.

Reconciliation of Refining segment gross margin to Adjusted refinery gross margin to Adjusted refinery gross margin per produced barrel sold and Adjusted refinery gross margin, less operating expenses per produced barrel sold

Three Months Ended March 31,

2024

2023

(In thousands, except per barrel amounts)

Refining segment

Sales and other revenues

$

6,204,245

6,718,615

Cost of products sold (exclusive of lower of cost or market inventory adjustment)

5,474,522

5,641,131

Lower of cost or market inventory adjustment

(220,558

)

—

Operating expenses

472,086

501,759

Depreciation and amortization

117,370

100,083

Gross margin

360,825

475,642

Add (subtract) lower of cost or market inventory adjustment

Add operating expenses

Add depreciation and amortization

Adjusted refinery gross margin

729,723

1,077,484

Produced barrels sold (BPD)

631,470

515,960

Gross margin per produced barrel sold

6.28

10.24

Adjusted refinery gross margin per produced barrel sold

12.70

23.20

Less refinery operating expenses per produced barrel sold

8.22

10.81

Adjusted refinery gross margin, less operating expenses per produced barrel sold

4.48

12.39

Reconciliation of renewables operating information (non-GAAP performance measures) to amounts reported under generally accepted accounting principles in financial statements.

Renewables Adjusted renewables gross margin and net operating margin are is a non-GAAP performance measures that are is used by our management and others to compare our renewables performance to that of other companies in our industry. We believe these this margin measures are measure is helpful to investors in evaluating our renewables performance on a relative and absolute basis. Renewables Adjusted renewables gross margin per produced gallon sold is the total Renewables segment revenues less the total Renewables segment cost of products sold, exclusive of gross margin plus lower of cost or market inventory valuation adjustments, depreciation and amortization and operating expenses, divided by sales volumes of produced renewables products sold. The net operating margin per produced gallon sold is the difference between the renewables gross margin and the renewables operating expenses per produced gallon sold. These two margins do This margin measure does not include the non-cash effects of lower of cost or market inventory valuation adjustments and depreciation and amortization. Each of these component performance measures can be reconciled directly to our consolidated statements of income, which relate to volumes in inventory at the end of the period. Adjusted renewables gross margin is not a calculation provided for under US GAAP and should not be considered in isolation or as a substitute for Renewables segment gross margin. The GAAP measure most directly comparable to Adjusted renewables gross margin is Renewables segment gross margin. Other companies in our industry may not calculate these performance measures in the same manner.

Reconciliation of Renewables segment gross margin to Adjusted renewables gross margin to Adjusted renewables gross margin per produced gallon sold and Adjusted renewables gross margin, less operating expenses per produced gallon sold

(In thousands, except per gallon amounts)

Renewables segment

239,559

298,016

230,273

262,738

1,188

47,597

26,461

31,371

20,272

19,974

(38,635

(63,664

Adjusted renewables gross margin

9,286

35,278

Produced gallons sold (in thousand gallons)

61,172

46,012

Gross margin per produced gallon sold

(0.63

(1.38

Adjusted renewables gross margin per produced gallon sold

0.15

0.77

Less renewables operating expense per produced gallon sold

0.43

0.68

Adjusted renewables gross margin, less operating expenses per produced gallon sold

(0.28

0.09

Reconciliation of marketing operating information (non-GAAP performance measures) to amounts reported under generally

Marketing Adjusted marketing gross margin is a non-GAAP performance measure that is used by our management and others to compare our marketing performance to that of other companies in our industry. We believe this margin measure is helpful to investors in evaluating our marketing performance on a relative and absolute basis. Marketing Adjusted marketing gross margin per gallon sold is the total Marketing segment revenues less the total Marketing segment cost of products sold gross margin plus depreciation and amortization, divided by sales volumes of marketing products sold. This margin does not include the non-cash effects of depreciation and amortization. This component performance measure can be reconciled directly to our consolidated statements of income Adjusted marketing gross margin is not a calculation provided for under US GAAP and should not be considered in isolation or as a substitute for Marketing segment gross margin. The GAAP measure most directly comparable to Adjusted marketing gross margin is Marketing segment gross margin. Other companies in our industry may not calculate these performance measures in the same manner.

Reconciliation of Marketing segment gross margin to Adjusted marketing gross margin to Adjusted marketing gross margin per gallon sold
Read in the reply
In its next report

First report after the company's reply of Jun 6, 2024: 10-Q filed Aug 1, 2024 ↗, against the 10-Q filed May 8, 2024 ↗.

Tickdelta does not hold the text of both reports, so they are not compared here.

Exhibit 99.1 · Reconciliations to Amounts Reported Under Generally Accepted Accounting Principles, page 14
SEC asked (3)
Considering the comments 1 and 2 above, please revise the applicable non-GAAP measures and related disclosures as appropriate. We also note the similar issues in your Form 8-K filed on May 8, 2024.
DINO answered
With respect to the Staff’s Comment 1 above, and consistent with our response to Comment 1 above, we do not believe the exclusion of lower of cost or market inventory valuation adjustments from its non-GAAP measures of Adjusted EBITDA, Refinery gross margin, Refining segment net operating margin per produced barrel sold, Renewables gross margin and Renewables segment net operating margin per produced gallon sold represent individually tailored recognition and measurement methods substituted for those of GAAP.
Rest of the answer

However, going forward, the Corporation will revise its description of the foregoing non-GAAP measures to clarify the nature of the inventory valuation adjustments and underlying inventory valuation methodology.

Consistent with our response to the Staff’s Comment 2 above, we will revise in future filings disclosures of the non-GAAP measures Refinery gross margin, Refining segment net operating margin per produced barrel sold, Renewables gross margin, Renewables net operating margin per produced gallon sold and Marketing gross margin per gallon sold as described above.
Read in the reply
In its next report

First report after the company's reply of Jun 6, 2024: 10-Q filed Aug 1, 2024 ↗, against the 10-Q filed May 8, 2024 ↗.

Tickdelta does not hold the text of both reports, so they are not compared here.

Reconciliations to Amounts Reported Under Generally Accepted Accounting Principles, page 76
SEC asked (1)
We note your proposed presentation of the comparable GAAP measure, gross margin in response to prior comment 2. Please explain to us why operating expenses are deducted in calculating GAAP gross margin. Please also clarify for us the types of costs included in operating expenses and the extent to which these costs are inventoriable based on the guidance in FASB ASC 330-10-30-1 through 8.
Rest of the question

In addition, your response should explain why you believe these costs are not required to be included in the cost of products sold measure that you separately report pursuant to Rule 5-03.2(a) of Regulation S-X.

DINO answered
In Note 1 of the Corporation’s audited financial statements included in the Form 10-K, “Cost of products sold” is defined as the cost of crude oil, other feedstocks, blendstocks and purchased finished products, inclusive of transportation costs (see Form 10-K, page 94). Our Cost of products sold differs from our Operating expenses in that Cost of products sold directly relates to (i) materials that are a component of our finished product sold, including costs directly related to any environmental credit obligations, (ii) delivery and transportation costs of such products, and (iii) gains and
Rest of the answer

losses on certain commodity contracts accounted for as economic hedges (see Form 10-K, page 115).

Additionally, “Operating expenses” include direct costs of labor, maintenance materials and services, utilities and other direct operating costs (see Form 10-K, page 94). Based on the guidance in FASB ASC 330-10-30-1, our operating expenses are inventoriable and, therefore, such costs are included in our inventories.

We believe our presentation of these two categories of costs reflects important measures of operating and financial performance of our Refining, Renewables and other segment results and is consistent with industry practice. We also believe the presentation of our statement of income appropriately includes the components that comprise cost of goods sold as indicated by Rule 5-03.2(a) of Regulation S-X.

However, based on the information described above and our review of the disclosure requirements of Rule

5-03.2(a), we propose that our financial statement line item labeled “Cost of products sold” be revised and presented as “Cost of materials and other” in our future filings. Additionally, we propose the inclusion of a “Cost of sales (exclusive of depreciation and amortization)” line that will aggregate and subtotal the cost components attributed to that measure. We believe that the inclusion of a Cost of sales measure in our statements of income will clarify that its component parts are inventoriable costs.

Please see below for an illustration of our proposed statement of income presentation based on financial information for the three months ended March 31, 2024, which is presented in thousands, except for per share data.

Three Months Ended

March 31,

2024

2023

Sales and other revenues

$

7,027,145

7,565,142

Operating costs and expenses:

Cost of sales (exclusive of depreciation and amortization):

Cost of materials and other (exclusive of lower of cost or market inventory valuation adjustment)

5,926,500

6,104,057

Lower of cost or market inventory valuation adjustment

(219,370

)

47,597

Operating expenses (exclusive of depreciation and amortization)

607,112

639,383

6,314,242

6,791,037

Selling, general and administrative expenses (exclusive of depreciation and amortization)

103,374

95,913

Depreciation and amortization

198,729

173,983

Total operating costs and expenses

6,616,345

7,060,933

Income from operations

410,800

504,209

Other income (expense):

Earnings of equity method investments

7,346

3,882

Interest income

22,179

19,935

Interest expense

(40,691

(45,822

Gain on foreign currency transactions

443

870

Gain on sale of assets and other

2,019

1,631

(8,704

(19,504

Income before income taxes:

402,096

484,705

Income tax expense:

Current

70,705

84,395

Deferred

14,769

15,305

85,474

99,700

Net income

316,622

385,005

Less: net income attributable to noncontrolling interest

1,958

31,739

Net income attributable to HF Sinclair stockholders

314,664

353,266

Earnings per share:

Basic

1.57

1.79

Diluted

Average number of common shares outstanding:

198,710

195,445

We also propose conforming presentation changes be made to our Segment Information in the notes to consolidated financial statements (see Form 10-K, page 128). As a result of this change, the segment Gross margin measure that will be included in our non-GAAP reconciliation will be computed as segment “Sales and other revenues”, less the segment “Cost of sales” subtotal and segment “Depreciation and amortization”.

Please see below for an illustration of our proposed reconciliation of Refining segment gross margin to Adjusted refinery gross margin, and

Refining segment gross margin per produced barrel sold to adjusted refinery gross margin, less operating expenses per produced barrel sold, in each case based on financial information for the three months ended March 31, 2024.

Three Months Ended March 31,

(In thousands, except per barrel amounts)

Refining segment

6,204,245

6,718,615

Cost of sales (exclusive of depreciation and amortization)

5,726,050

6,142,890

117,370

100,083

Gross margin

360,825

475,642

Add (subtract) lower of cost or market inventory adjustment

(220,558

—

Add operating expenses

472,086

501,759

Add depreciation and amortization

Adjusted refinery gross margin

729,723

1,077,484

Produced barrels sold (BPD) (1)

631,470

515,960

Gross margin per produced barrel sold

6.28

10.24

Add (subtract) lower of cost or market inventory adjustment per produced barrel sold

(3.84

Add operating expenses per produced barrel sold

8.22

10.81

Add depreciation and amortization per produced barrel sold

2.04

2.15

Adjusted refinery gross margin per produced barrel sold

12.70

23.20

Less operating expenses per produced barrel sold

Adjusted refinery gross margin, less operating expenses per produced barrel sold

4.48

12.39

(1)

Represents the number of produced barrels sold per calendar day in the period.

In future filings, we will make corresponding edits in our presentation of the reconciliations of Adjusted renewables gross margin and

Adjusted renewables gross margin, less operating expenses per produced barrel sold.

Read in the reply
In its next report

First report after the company's reply of Jul 23, 2024: 10-Q filed Aug 1, 2024 ↗, against the 10-Q filed May 8, 2024 ↗.

Tickdelta does not hold the text of both reports, so they are not compared here.

Reconciliations to Amounts Reported Under Generally Accepted Accounting Principles, page 76
SEC asked (2)
Your proposed disclosures in response to prior comment 2 present reconciliations of Adjusted refinery/renewables gross margin, less operating expenses per produced barrel/gallon sold to another non-GAAP measure, Adjusted refinery/renewables gross margin per produced barrel/gallon sold.
Rest of the question

Please revise to include reconciliations that start with the most directly comparable GAAP measure to comply with Item 10(e)(1)(i) of Regulation S-K.

DINO answered
The Corporation respectfully acknowledges the Staff’s comment and proposes, in future filings, to present a reconciliation from segment Gross margin per produced barrel sold, to segment Adjusted refinery/renewables gross margin per produced barrel sold, to segment Adjusted refinery/renewables gross margin, less operating expenses per produced barrel sold. Please see Comment 1 above for an illustration of our proposed revised reconciliations of this non-GAAP measure for the three months ended March 31, 2024.
Read in the reply
In its next report

First report after the company's reply of Jul 23, 2024: 10-Q filed Aug 1, 2024 ↗, against the 10-Q filed May 8, 2024 ↗.

Tickdelta does not hold the text of both reports, so they are not compared here.

Also in this review: request for more time, May 30, 2024, closing letter, 2024-07-25

Letters without questions

Other letters

UPLOAD and CORRESP
6 other letters: notices that a filing will not be reviewed, requests to declare a registration effective, and the like

From the SEC's correspondence on EDGAR: staff letters (form UPLOAD) and company letters (form CORRESP), 14 letters filed since 2022-09-19. Questions and answers are matched by their numbers; topics come from words in each question. The reports are compared word for word (same form, before the first SEC letter against the first report after the company's reply). No AI.

Sources

The SEC's correspondence on EDGAR: staff letters (form UPLOAD) and company letters (form CORRESP), matched question by question. No AI.

Also

Filings: the letters in the filing list.

Work with it

Excel workbook · CSV. Google Sheet that stays up to date: paste =IMPORTDATA("https://tickdelta.com/company/DINO/export.csv") into a cell.

Next in Owners and insiders:Insider trades
Esc

Type a ticker such as AAPL, a name, an investor such as Buffett, or a topic such as tariffs. ↑ ↓ to move, Enter to open.