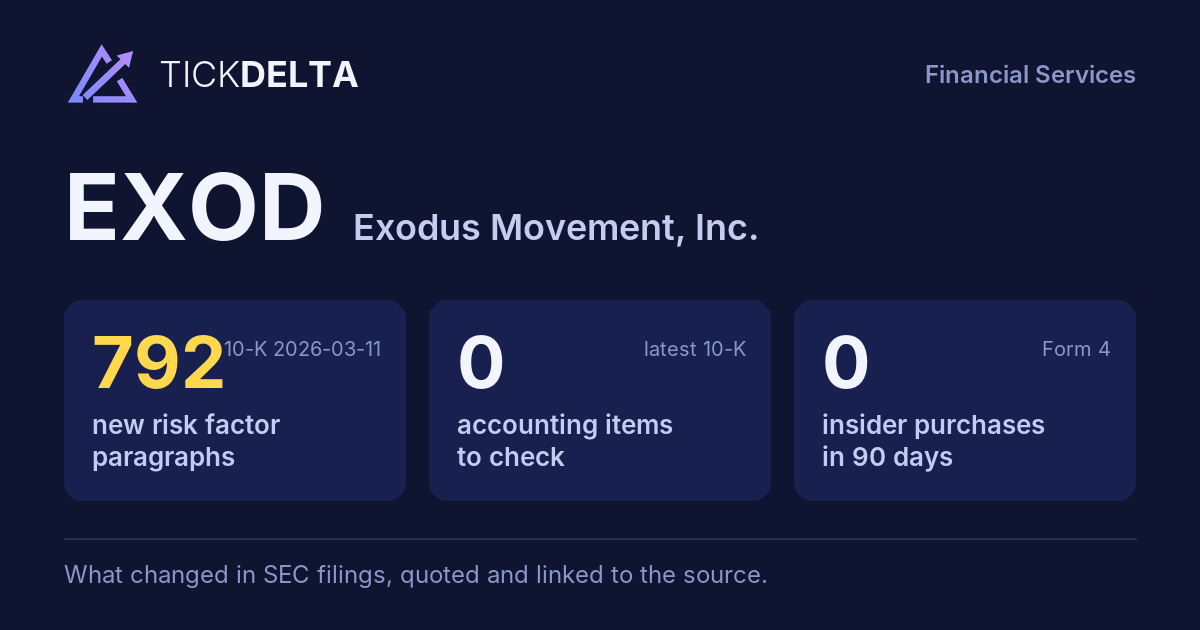
EXODExodus Movement
LLC ("3ZERO"), XO Italia S.R.L., Osmium, LLC, Osmium Europe B.V., Osmium Canada LTD and Osmium AU PTY LTD. Additionally, references to our “Board” refer to the board of directors of Exodus Movement, Inc. 10-K, Item 1
- Headquarters
- Omaha, NE
- CEO
- Jon Paul Richardson
- Next results
- around Mar 10, 2027
EXOD and 9 peers, year by year
The 9 Crypto companies closest to EXOD in revenue over the last twelve months. Every number is from the 10-K and links to it in SEC's Inline XBRL viewer.
Choose the peers
| Company | Year | Revenue | Sales growth | Gross margin | Operating margin | Net margin | FCF margin | Return on equity | Debt / equity |
|---|---|---|---|---|---|---|---|---|---|
| EXOD Exodus Movement | FY2025 | $121.6M | +4.5% | - | - | −9.3% | −21.2% | −4.6% | - |
| BTBT Bit Digital | FY2025 | $113.6M | +5.1% | - | −80.9% | −70.7% | −506.2% | −11.1% | - |
| CIFR Cipher Digital | FY2025 | $223.9M | +48.0% | - | −188.2% | −367.2% | −310.7% | −102.1% | 3.41 |
| BMNR Bitmine Immersion Technologies | FY2025 | $6.1M | +84.1% | - | n/m | n/m | −85.5% | 4.0% | - |
| FWDI Forward Industries | FY2025 | $18.2M | −9.0% | 28.5% | −46.1% | −918.1% | −24.9% | −11.4% | - |
| SBET Sharplink | FY2025 | $28.1M | +666% | - | n/m | n/m | −62.6% | −30.4% | - |
| WULF TeraWulf | FY2025 | $168.5M | +20.3% | 39.2% | −110.5% | −392.6% | −702.5% | n/m | n/m |
| UPXI Upexi | FY2026 | $25.0M | n/m | 89.5% | −963.5% | −984.3% | −84.0% | n/m | n/m |
| BTCS BTCS | FY2025 | $16.5M | +305% | 12.2% | - | −202.2% | −59.4% | −23.9% | - |
| DFDV DeFi Development | FY2025 | $11.4M | +442% | - | −319.7% | −648.1% | −157.8% | −74.3% | 1.28 |
Revenue, FY2023 to FY2025
Revenue as reported in the 10-K.| Company | FY2023 | FY2024 | FY2025 |
|---|---|---|---|
| EXOD Dec | $56.2M | $116.3M | $121.6M |
| BTBT Dec | $44.9M | $108.1M | $113.6M |
| CIFR Dec | $126.8M | $151.3M | $223.9M |
| BMNR Aug | $645K | $3.3M | $6.1M |
| FWDI Sep | $36.7M | $20.0M | $18.2M |
| SBET Dec | $5.0M | $3.7M | $28.1M |
| WULF Dec | $69.2M | $140.1M | $168.5M |
| UPXI Jun | $36.4M | $26.0M | $15.8M |
| BTCS Dec | $1.3M | $4.1M | $16.5M |
| DFDV Dec | $2.0M | $2.1M | $11.4M |
| Peer median | $36.4M | $20.0M | $18.2M |
Sales growth, FY2023 to FY2025
Revenue against the fiscal year before.| Company | FY2023 | FY2024 | FY2025 |
|---|---|---|---|
| EXOD Dec | - | +107% | +4.5% |
| BTBT Dec | +39.1% | +141% | +5.1% |
| CIFR Dec | n/m | +19.3% | +48.0% |
| BMNR Aug | +50.9% | +413% | +84.1% |
| FWDI Sep | −4.0% | −17.7% | −9.0% |
| SBET Dec | +41.9% | −26.1% | +666% |
| WULF Dec | +361% | +102% | +20.3% |
| UPXI Jun | +250% | −28.7% | −39.2% |
| BTCS Dec | −20.8% | +204% | +305% |
| DFDV Dec | −6.9% | +4.8% | +442% |
| Peer median | +40.5% | +19.3% | +48.0% |
Gross margin, FY2023 to FY2025
Gross profit / revenue.Operating margin, FY2023 to FY2025
Operating income / revenue.| Company | FY2023 | FY2024 | FY2025 |
|---|---|---|---|
| EXOD Dec | - | - | - |
| BTBT Dec | −37.0% | 25.5% | −80.9% |
| CIFR Dec | −15.9% | −28.9% | −188.2% |
| BMNR Aug | −374.0% | −73.9% | n/m |
| FWDI Sep | 0.4% | −10.8% | −46.1% |
| SBET Dec | −179.6% | −130.1% | n/m |
| WULF Dec | −42.5% | −54.4% | −110.5% |
| UPXI Jun | −33.7% | −86.4% | −79.1% |
| BTCS Dec | - | - | - |
| DFDV Dec | −170.0% | −143.0% | −319.7% |
| Peer median | −39.7% | −64.2% | −95.7% |
Net margin, FY2023 to FY2025
Net income / revenue.| Company | FY2023 | FY2024 | FY2025 |
|---|---|---|---|
| EXOD Dec | 22.8% | 97.1% | −9.3% |
| BTBT Dec | −30.9% | 26.2% | −70.7% |
| CIFR Dec | −20.3% | −29.5% | −367.2% |
| BMNR Aug | −382.0% | −99.5% | n/m |
| FWDI Sep | −10.2% | −9.8% | −918.1% |
| SBET Dec | −287.6% | 275.8% | n/m |
| WULF Dec | −106.1% | −51.7% | −392.6% |
| UPXI Jun | −48.0% | −91.0% | −86.5% |
| BTCS Dec | 583.6% | −31.2% | −202.2% |
| DFDV Dec | −168.4% | −129.9% | −648.1% |
| Peer median | −48.0% | −31.2% | −367.2% |
Free cash flow, FY2023 to FY2025
Cash from operations minus capital spending.| Company | FY2023 | FY2024 | FY2025 |
|---|---|---|---|
| EXOD Dec | $625K | −$12.3M | −$25.8M |
| BTBT Dec | −$65.6M | −$107.0M | −$574.9M |
| CIFR Dec | −$114.7M | −$227.0M | −$695.9M |
| BMNR Aug | −$1.4M | −$106K | −$5.2M |
| FWDI Sep | $905K | $455K | −$4.5M |
| SBET Dec | $571K | −$22.8M | −$17.6M |
| WULF Dec | −$70.9M | −$292.4M | −$1.2B |
| UPXI Jun | −$735K | −$1.0M | −$8.8M |
| BTCS Dec | −$3.6M | −$3.5M | −$9.8M |
| DFDV Dec | −$1.6M | −$2.4M | −$18.0M |
| Peer median | −$1.6M | −$3.5M | −$17.6M |
FCF margin, FY2023 to FY2025
Free cash flow / revenue.| Company | FY2023 | FY2024 | FY2025 |
|---|---|---|---|
| EXOD Dec | 1.1% | −10.6% | −21.2% |
| BTBT Dec | −145.9% | −99.0% | −506.2% |
| CIFR Dec | −90.4% | −150.1% | −310.7% |
| BMNR Aug | −220.4% | −3.2% | −85.5% |
| FWDI Sep | 2.5% | 2.3% | −24.9% |
| SBET Dec | 11.5% | −623.0% | −62.6% |
| WULF Dec | −102.4% | −208.8% | −702.5% |
| UPXI Jun | −2.0% | −4.0% | −55.7% |
| BTCS Dec | −266.3% | −86.7% | −59.4% |
| DFDV Dec | −79.7% | −116.2% | −157.8% |
| Peer median | −90.4% | −99.0% | −85.5% |
Return on equity, FY2023 to FY2025
Net income / shareholders' equity at the year end.| Company | FY2023 | FY2024 | FY2025 |
|---|---|---|---|
| EXOD Dec | 12.3% | 43.9% | −4.6% |
| BTBT Dec | −9.1% | 6.1% | −11.1% |
| CIFR Dec | −5.2% | −6.5% | −102.1% |
| BMNR Aug | −39.4% | −80.6% | 4.0% |
| FWDI Sep | −142.8% | −65.7% | −11.4% |
| SBET Dec | n/m | n/m | −30.4% |
| WULF Dec | −33.0% | −29.6% | n/m |
| UPXI Jun | −62.8% | n/m | −15.2% |
| BTCS Dec | 29.9% | −3.7% | −23.9% |
| DFDV Dec | −58.0% | −77.9% | −74.3% |
| Peer median | −36.2% | −29.6% | −19.6% |
Debt / equity, FY2023 to FY2025
Total debt / shareholders' equity at the year end.EPS (diluted), FY2023 to FY2025
Diluted earnings per share, on today's share count after splits.| Company | FY2023 | FY2024 | FY2025 |
|---|---|---|---|
| EXOD Dec | - | - | - |
| BTBT Dec | −$0.16 | $0.19 | −$0.31 |
| CIFR Dec | −$0.10 | −$0.14 | −$2.15 |
| BMNR Aug | −$1.00 | −$1.32 | $13.39 |
| FWDI Sep | −$3.39 | −$1.77 | −$24.59 |
| SBET Dec | −$5.17 | $27.62 | −$7.37 |
| WULF Dec | −$0.35 | −$0.21 | −$1.66 |
| UPXI Jun | −$18.94 | −$23.03 | −$1.73 |
| BTCS Dec | $0.45 | −$0.08 | −$1.00 |
| DFDV Dec | −$0.46 | −$0.28 | −$4.00 |
| Peer median | −$0.46 | −$0.21 | −$1.73 |
Fiscal years are lined up as each company's 10-K names them; the month next to a ticker is when its year ends. Hover a number for the XBRL line items and the filing; click it to open the filing on sec.gov. "n/m" means not meaningful: equity below zero, or a base so close to zero that the ratio says nothing. The peer median leaves out EXOD and needs at least three peers with the number. P/E, P/S and P/FCF at each year end appear here once the site has daily prices. What the same companies write about AI, tariffs and more →
Work on EXOD in a spreadsheet:
Excel workbook (a sheet per section, ten years by column, charts, links to the filings) ·
CSV.
For a Google Sheet that stays up to date, paste =IMPORTDATA("https://tickdelta.com/company/EXOD/export.csv") into a cell.