FIXComfort Systems USA
Comfort Systems USA, Inc., a Delaware corporation, was established in 1997. 10-K, Item 1
- Employees
- 22,700
- Headquarters
- Houston, TX
- CEO
- Brian E. Lane
- Next results
- around Feb 18, 2027
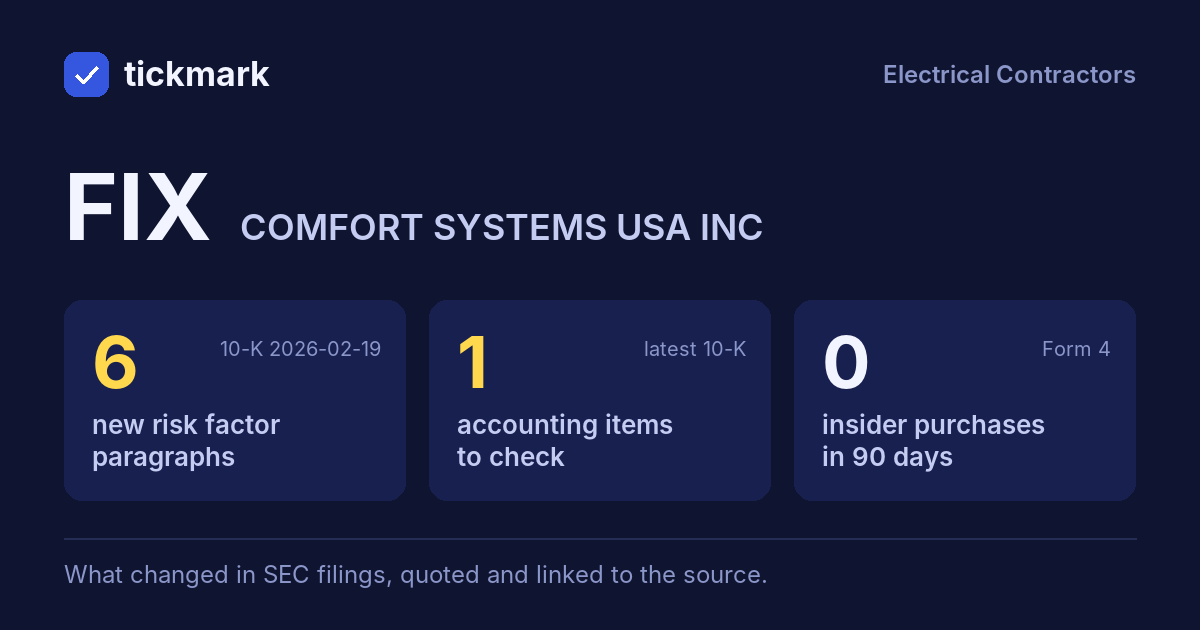
The biggest changes in the 10-K filed 2026-02-19, this fiscal year against the last, and the sentences in the MD&A (Item 7) where management explains them, quoted word for word. Tickdelta picks sentences that name the line, a direction and a cause. It does not write explanations of its own.
Net income
+95.7% Big change FY to 2025-12-31 vs 2024-12-31The MD&A has no sentence that names a cause for this change. That can be worth a question: ask about the filing.
Cash from operations
+39.7% Big change FY to 2025-12-31 vs 2024-12-31“The $337.3 million increase in cash provided by operating activities was primarily driven by higher earnings before non-cash expenses such as amortization of intangible assets in the current year and an $877.9 million benefit from changes in billings in excess of costs and estimated earnings and deferred revenue driven by the timing of customer billings and payments.”
Read it in the 10-K ↗
Operating margin
10.7% → 14.4% (+3.8 pts) Big change FY to 2025-12-31 vs 2024-12-31The MD&A has no sentence that names a cause for this change. That can be worth a question: ask about the filing.
Gross margin
21.0% → 24.1% (+3.1 pts) Big change FY to 2025-12-31 vs 2024-12-31“The same-store increase in gross profit was primarily driven by both higher revenues in the current year as well as improved execution in our operations, including increased volumes at our Texas electrical operation ($161.5 million), one of our North Carolina operations ($71.6 million) and one of our Indiana operations ($76.0 million).”
Read it in the 10-K ↗
Revenue
+29.5% Big change FY to 2025-12-31 vs 2024-12-31“The same-store revenue increase primarily resulted from an increase in activity in the technology sector at one of our North Carolina operations ($267.5 million), our Texas modular operation ($206.5 million), one of our Indiana operations ($137.2 million) and one of our Virginia operations ($109.7 million).”
Read it in the 10-K ↗
“The same-store revenue increase primarily resulted from an increase in activity in the technology sector at our Texas electrical operation ($649.3 million).”
Read it in the 10-K ↗
Changes are computed from the XBRL figures in the same 10-K. Hover a number to see the line item. Open the 10-K ↗
Work on FIX in a spreadsheet:
Excel workbook (a sheet per section, ten years by column, charts, links to the filings) ·
CSV.
For a Google Sheet that stays up to date, paste =IMPORTDATA("https://tickdelta.com/company/FIX/export.csv") into a cell.