Screener / SEC EDGAR /CIK 0001049521 /10-K filed Aug 18, 2026, compared with Aug 11, 2025 /Numbers from the XBRL of the 10-Ks
Nasdaq Technology · Electronic Components

Mercury Systems Inc MRCY

Compare with peers Embed
SEC comment letters, last 20 years

3 reviews of MRCY's filings by SEC staff

UPLOAD and CORRESP
Reviews 3 latest letter Feb 1, 2024
Questions asked 14 each answered in the company's own letter
No closing letter 0 reviews without a letter saying the staff completed it

When the SEC's staff reviews a filing, it writes to the company with numbered questions, and the company answers each one in a letter. SEC publishes the exchange once the review is over, at least 20 business days later. A question is not an accusation; most reviews end with the company adding detail to its next filing.

How the reviews went

Every review on EDGAR, from the first staff letter to the letter that closes it

  1. 1. Staff letters 5 UPLOAD
  2. 2. Questions in them 14 numbered comments
  3. 3. Company replies 5 CORRESP
  4. 4. Reviews closed 3 of 3 closing letter

Half the closed reviews took 19 days or less from the first letter to the closing letter.

Form 10-K for the Year Ended June 30, 2023

2024-02-01 to 2024-02-20 · 3 questions · 1 letter from the SEC, 1 from the company
Review closed 2024-02-20
Results discussion (MD&A)RevenueCritical estimatesGoodwill and impairment
Note B. Summary of Significant Accounting Policies · Revenue Recognition, page 55
SEC asked (1)
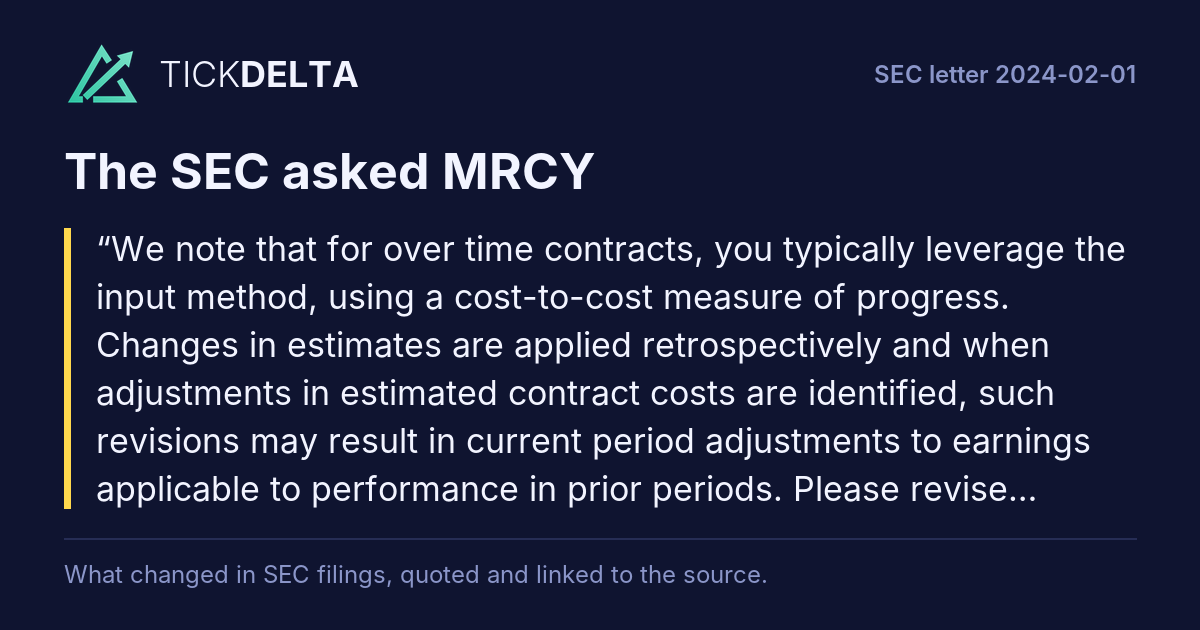
We note that for over time contracts, you typically leverage the input method, using a cost-to-cost measure of progress. Changes in estimates are applied retrospectively and when adjustments in estimated contract costs are identified, such revisions may result in current period adjustments to earnings applicable to performance in prior periods.
Rest of the question

Please revise future filings to disclose the change in contract estimates that impacted operating profits for each year presented pursuant to ASC 250-10-50-4. Also, please revise your disclosure in MD&A to provide the gross amount of favorable and unfavorable adjustments to contract estimates to complete for each period presented. To the extent material, please revise your disclosure to address such circumstances, accompanied by an appropriate level of analysis of the underlying reasons for the significant changes. We believe such disclosure will give investors more insight to the estimation process associated with your contracts, as discussed in “Critical Accounting Estimates,” and the separate potential impacts on your results. As part of your response, please provide us with a copy of your intended revised disclosure.

MRCY answered
50 Minuteman Road, Andover, Massachusetts 01810 U.S.A. | +1-(978)-256-1300 | www.mrcy.com | twitter: @MRCY February 14, 2024 Via EDGAR Division of Corporation Finance U.S. Securities and Exchange Commission 100 F Street, N.E. Washington, D.C. 20549 Attention: Claire Erlanger Office of Manufacturing Re: Mercury Systems, Inc. Form 10-K for the Year Ended June 30, 2023 Filed August 15, 2023 File No. 001-41194 Dear Ms. Erlanger: This letter is submitted by Mercury Systems, Inc. (the “Company,” “Mercury” or “we”) in response to the comments from the staff (the “Staff”) of the Division of Corporation Finance of the U.S.
Rest of the letter

Securities and Exchange Commission (the “Commission”) as set forth in your letter dated February 1, 2024 (the “Comment Letter”) to David E. Farnsworth regarding the Company’s Form 10-K for the year ended June 30, 2023, File No. 001-41194. For ease of reference, the text of your comments contained in the Comment Letter are printed below in bold and are followed by the Company’s responses. Form 10-K for the year ended June 30, 2023 Notes to Consolidated Financial Statements Note B. Summary of Significant Accounting Policies Revenue Recognition, page 55 1. We note that for over time contracts, you typically leverage the input method, using a cost-to-cost measure of progress. Changes in estimates are applied retrospectively and when adjustments in estimated contract costs are identified, such revisions may result in current period adjustments to earnings applicable to performance in prior periods. Please revise future filings to disclose the change in contract estimates that impacted operating profits for each year presented pursuant to ASC 250-10-50-4. Also, please revise your disclosure in MD&A to provide the gross amount of favorable and unfavorable adjustments to contract estimates to complete for each period presented. To the extent material, please revise your disclosure to address such circumstances, accompanied by an appropriate level of analysis of the underlying reasons for the significant changes. We believe such disclosure will give investors more insight to the estimation process associated with your contracts, as discussed in “Critical Accounting Estimates,” and the separate potential impacts on 50 Minuteman Road, Andover, Massachusetts 01810 U.S.A. | +1-(978)-256-1300 | www.mrcy.com | twitter: @MRCY your results. As part of your response, please provide us with a copy of your intended revised disclosure. Mercury Response to Comment 1: We acknowledge the Staff’s comment and propose to include disclosure of the change in contract estimates that impacted operating profits for each year presented pursuant to ASC 250-10-50-4 as well as the gross amount of favorable and unfavorable adjustments to contract estimates within our MD&A. Below is an example of what we intend to disclose in future filings which includes the additional quantifying factors which contribute to material changes for the discussion on the Results of Operations using our Form 10-K for the Fiscal Year Ended June 30, 2023. Note B. Summary of Significant Accounting Policies Revenue Recognition, page 55 Changes in estimates are applied retrospectively and when adjustments in estimated contract costs are identified, such revisions may result in current period adjustments to earnings applicable to performance in prior periods. The aggregate effects of these favorable and unfavorable changes across the Company’s portfolio of programs can have a significant effect upon its reported (Loss) income from operations, Net (loss) income and Diluted net (loss) earnings per share in each of the reporting periods. The net impact of changes in estimates had the following impact on the Company’s operating results: MD&A. Results of Operations, page 35 Gross margin was 32.5% for fiscal 2023, a decrease of 750 basis points from the 40.0% gross margin achieved during fiscal 2022. This was primarily driven by approximately $56.3 million of net impact as a result of changes in estimates from technical and execution challenges especially as related to approximately 20 programs, primarily development in nature. We had the following aggregate effects of favorable and unfavorable margin impacts as a result of changes in estimates across our portfolio for the periods presented: The changes in estimates are assessed based on historical results and cumulative adjustments are recorded to recognize revenue to date based on changes in estimated margin on programs, factored for potential risks and opportunities. We utilize the latest and best information available when revising our estimates and apply consistent judgement across the full portfolio of programs. (In thousands, except per share data) Fiscal 2023 Fiscal 2022 Fiscal 2021 (Loss) income from operations $ (56,266) $ (14,069) $ (2,586) Net (loss) income (1) (44,450)$ (11,114)$ (2,043)$ Diluted net (loss) earnings per share $ (0.79) $ (0.20) $ (0.04) Diluted Shares 56,554 55,901 55,474 (1) Statutory rate of 21% (in millions) Fiscal 2023 Fiscal 2022 Gross favorable $ 12.3 $ 14.6 Gross unfavorable (68.6) (28.7) Net impact of change in estimates $ (56.3) $ (14.1) 50 Minuteman Road, Andover, Massachusetts 01810 U.S.A. | +1-(978)-256-1300 | www.mrcy.com | twitter: @MRCY In addition, gross margin decreased due to a greater proportion of development programs as compared to the prior period. Development programs carry lower average gross margins as compared to production programs. These programs warrant higher engineering labor for customized development, production and service activities. The nature of these efforts results in lower margin content but serve as pre-cursors to higher margin production awards. Contract Assets, page 57 2. We note your disclosure that the contract asset balance increased due to growth in revenue recognized under contracts, as well as the timing of program milestone billings during the fiscal year ended June 30, 2023. Please revise future filings to quantify each of the significant changes in the balance. Also, disclose the nature and status of amounts representing claims or other similar items subject to uncertainty concerning their determination or ultimate realization, and any amounts that are expected to be billed/collected after one year. See guidance in ASC 606-10-50-10 and Rule 5-02(3)(c) of Regulation S-X. Mercury Response to Comment 2: We acknowledge the Staff’s comment and propose to revise our disclosure to quantify each of the significant changes in contract asset balances in each of our future filings. Below is an example of what we intend to disclose in future filings which includes the additional quantifying factors which contribute to changes in contract asset balances using our Form 10-K for the Fiscal Year Ended June 30, 2023. In regard to disclosure around the nature and status of amounts representing claims or other similar items subject to uncertainty concerning their determination or ultimate realization, and any amounts that are expected to be billed/collected after one year, it should be noted that we have no contract assets which include claims or other similar items subject to uncertainty concerning their determination or ultimate realization. It should also be noted that we do not have any amounts that are expected to be billed or collected beyond one year. As such, we believe this element of the requested disclosure is not currently warranted under Rule 5-02(3)(c) of Regulation S-X. Note B. Summary of Significant Accounting Policies Contract Balances, page 57 The contract asset balances were $382,558 and $303,356 as of June 30, 2023, and July 1, 2022, respectively. The contract asset balance increased due to growth in revenue recognized under over time contracts of $XX,XXX, partially offset by $XX,XXX in billings during the fiscal year ended June 30, 2023. 3. We note your disclosure that you performed the annual goodwill impairment test in the fourth quarter of fiscal 2023 with no impairment noted. Given the significance of your goodwill balance and overall decline in your market capitalization, as well as deteriorating operating results, please revise your notes to the financial statements in future filings to address the following: • Provide a discussion of how goodwill and other intangible assets were tested in 2023, including whether you performed a qualitative and/or quantitative test; • Expand your disclosure to state whether or not the fair value of your reporting units "substantially exceeds" the carrying value. To the extent any reporting unit fair values 50 Minuteman Road, Andover, Massachusetts 01810 U.S.A. | +1-(978)-256-1300 | www.mrcy.com | twitter: @MRCY are not substantially in excess of fair values, disclose the name of those reporting units and the amount or percentage by which the fair value exceeds their carrying value; • Explain how you consider market capitalization in determining the estimated fair values of the reporting units. Refer to ASC-350-20-35-3C; Additionally, please revise your disclosure in the Critical Accounting Policies section of MD&A to provide a more detailed description of the key assumptions you used to estimate fair value of the reporting units during your impairment analysis, including how the key assumptions were determined, and to discuss the degree of uncertainty associated with the key assumptions, including material changes in the key assumptions during the periods presented. Please provide us with a copy of your intended disclosure. Mercury Response to Comment 3: We acknowledge the Staff’s comment and propose to revise and expand our disclosure to provide a discussion of how goodwill and other intangible assets were tested for impairment, state whether or not the fair value of our reporting units "substantially exceeds" the carrying value, to the extent any reporting unit fair values are not substantially in excess of fair values, we will disclose the name of those reporting units and the amount or percentage by which the fair value exceeds their carrying value, and explain how market capitalization is considered in determining the estimated fair values of our report units. Additionally, we propose to revise our disclosure in the Critical Accounting Policies section of our MD&A to provide a more detailed description of the key assumptions used to estimate the fair value of our reporting units during our impairment analysis, including how the key assumptions were determined, and to discuss the degree of uncertainty associated with the key assumptions, including material changes in the key assumptions during the periods presented. Below is an example of what we intend to disclose in future filings specific to Goodwill and Intangible Assets. For your convenience, updated or new verbiage has been underlined. Note B. Summary of Significant Accounting Policies Goodwill and Intangible Assets, page 59 Goodwill is the amount by which the purchase price of a business acquisition exceeded the fair values of the net identifiable assets on the date of purchase (see Note G). In accordance with the requirements of Intangibles-Goodwill and Other (“ASC 350”), goodwill is not amortized. Goodwill is assessed for impairment at least annually, on a reporting unit basis, or when events and circumstances (“triggering event”) occur indicating that the recorded goodwill may be impaired. Potential triggering events include macroeconomic conditions, industry and market considerations, financial performance and expectations of projected financial performance and cash flows, and changes in the Company's stock price in relation to the carrying value of its reporting units, among other relevant factors. Adverse changes to these events and circumstances could require the Company to perform an interim impairment test. Intangible assets result from the Company’s various business acquisitions (see Note H) and certain licensed technologies, and consist of identifiable intangible assets, including completed technology, licensing agreements, patents, customer relationships, trademarks, backlog and non-compete agreements. Intangible assets are reported at cost, net of accumulated amortization and are either amortized on a straight-line basis over their estimated useful lives of up to 12.5 years or over the period the economic benefits of the intangible asset are consumed. 50 Minuteman Road, Andover, Massachusetts 01810 U.S.A. | +1-(978)-256-1300 | www.mrcy.com | twitter: @MRCY Note G. Goodwill, page 66 In accordance with FASB ASC 350, Intangibles-Goodwill and Other (“ASC 350”), the Company determines its reporting units based upon whether discrete financial information is available, if management regularly reviews the operating results of the component, the nature of the products offered to customers and the market characteristics of each reporting unit. A reporting unit is considered to be an operating segment or one level below an operating segment also known as a component. Component level financial information is reviewed by management across two reporting units: Mission Systems and Microelectronics. Accordingly, these were determined to be the Company's reporting units which is consistent with the prior period. The following table sets forth the changes in the carrying amount of goodwill for the twelve months ended June 30, 2023: Total Balance at July 1, 2022 $ 937,880 Goodwill adjustment for the Avalex acquisition 66 Goodwill adjustment for the Atlanta Micro acquisition 147 Balance at June 30, 2023 $ 938,093 The Company performed its annual goodwill impairment test in the fourth quarter of fiscal 2023. The Company estimates its fair value and compares the fair value with the carrying value of its reporting units, including goodwill using an income approach based upon a discounted cash flow (“DCF”) model to calculate the present value of cash flows to estimate its implied fair value. The future cash flows for the Company’s reporting units were projected based on the Company’s estimates, at that time, of future revenues, expenses, capital expenditures, and working capital. The discount rates used in the Company’s DCF model were based on a weightedaverage cost of capital (“WACC”) determined from relevant market comparisons, adjusted upward for specific reporting unit risks (primarily the uncertainty of achieving projected operating cash flows). A terminal value growth rate was applied to the final year of the projected period, which reflects the Company’s estimate of stable, perpetual growth. The Company then calculated a present value of the respective cash flows for each reporting unit to arrive at an estimate of fair value under the income approach. In addition, the Company uses the market approach, which compares the reporting unit to publicly traded companies and transactions involving similar businesses, to support the conclusions of the income approach. Finally, the Company compared its estimates of fair values to its total market capitalization to assess the reasonableness of the reporting units combined determined fair value. Based on the quantitative evaluation, the Company determined that the Mission Systems reporting unit had an estimated fair value in excess of their carrying value of at least 15.6% and the Microelectronics reporting unit had an estimated fair value that substantially exceeded its carrying value. The Company concluded that its goodwill was not impaired. The Company is required to perform the next annual goodwill impairment analysis during the fourth quarter of fiscal year 2024. Adverse changes to its assessment of potential triggering events could require the Company to perform an interim impairment test. If assumed revenue growth rate and cash flow projections are not achieved in future periods or the Company’s common stock price significantly declines from current levels, among other factors, its Mission Systems and Microelectronics reporting units could be at risk of failing the quantitative assessment and goodwill assigned to the respective reporting units could be impaired. Any impairment charges that the Company may record in the future could be material to its results of operations and financial condition. 50 Minuteman Road, Andover, Massachusetts 01810 U.S.A. | +1-(978)-256-1300 | www.mrcy.com | twitter: @MRCY Note H. Intangible Assets, page 67. Intangible assets consisted of the following: Gross Carrying Amount Accumulated Amortization Net Carrying Amount Weighted Average Useful Life June 30, 2023 Customer relationships $ 349,120 $ (130,756) $ 218,364 12.1 years Licensing agreements and patents 4,162 (1,423) 2,739 5.0 years Completed technologies 134,983 (60,680) 74,303 8.0 years Backlog 410 (325) 85 2.0 years Other 3,236 (676) 2,560 5.0 years $ 491,911 $ (193,860) $ 298,051 July 1, 2022 Customer relationships $ 349,710 $ (99,219) $ 250,491 12.1 years Licensing agreements and patents 4,162 (592) 3,570 5.0 years Completed technologies 161,023 (68,264) 92,759 8.5 years Backlog 7,670 (5,880) 1,790 1.4 years Other 3,236 (308) 2,928 5.0 years $ 525,801 $ (174,263) $ 351,538 Estimated future amortization expense for intangible assets remaining at June 30, 2023, is as follows: Fiscal Year Totals 2024 $ 47,540 2025 42,836 2026 38,199 2027 35,093 2028 31,169 Thereafter 101,822 Total future amortization expense $ 296,659 Estimated salvage value of identified intangible assets 1,392 Net carrying amount $ 298,051 The Company reviews net intangible assets with finite lives for impairment when an event occurs indicating the potential for impairment. Based on the Company’s last assessment, the Company believes that the carrying values of net intangible assets were recoverable as of June 30, 2023. However, if business conditions deteriorate, the Company may be required to record impairment losses, and or increase the amortization of intangibles in the future. Any impairment charges that the Company may record in the future could be material to the results of operations and financial condition. 50 Minuteman Road, Andover, Massachusetts 01810 U.S.A. | +1-(978)-256-1300 | www.mrcy.com | twitter: @MRCY MD&A. Critical Accounting Policies and Significant Judgements and Estimates, page 45 GOODWILL, INTANGIBLE ASSETS AND LONG-LIVED ASSETS We evaluate our goodwill for impairment annually in the fourth quarter and in any interim period in which events or circumstances arise that indicate our goodwill may be impaired. Indicators of impairment include, but are not limited to, a significant deterioration in overall economic conditions, a decline in our market capitalization, the loss of significant business, significant decreases in funding for our contracts, or other significant adverse changes in industry or market conditions. We test goodwill for impairment at the reporting unit level. Goodwill impairment guidance provides entities an option to perform a qualitative assessment (commonly known as “step zero”) to determine whether further impairment testing is necessary before performing the two-step test. The qualitative assessment requires significant judgments by management about macro-economic conditions including our operating environment, industry and other market considerations, entity-specific events related to financial performance or loss of key personnel, and other events that could impact the reporting unit. If we conclude that further testing is required, the impairment test involves a two-step process. Step one compares the fair value of the reporting unit with its carrying value, including goodwill. If the carrying amount exceeds the fair value of the reporting unit, step two is required to determine if there is an impairment of the goodwill. Step two compares the implied fair value of the reporting unit's goodwill to the carrying amount of the goodwill. We estimate the fair value of our reporting units using the income approach based upon a discounted cash flow (“DCF”) model. The income approach requires the use of many assumptions and estimates including future revenues, expenses, capital expenditures, and working capital, as well as discount factors and income tax rates. The discount rates used in the DCF model were based on a weighted-average cost of capital (“WACC”) determined from relevant market comparisons, adjusted upward for specific reporting unit risks (primarily the uncertainty of achieving projected operating cash flows). A terminal value growth rate was applied to the final year of the projected period, which reflects our estimate of stable, perpetual growth. We then calculated a present value of the respective cash flows for each reporting unit to arrive at an estimate of fair value under the income approach. Finally, we compared the estimates of our fair values to our total market capitalization to assess the reasonableness of our reporting units’ combined determined fair value. Key assumptions of the forecast model over expected revenues, expenses, capital expenditures, and working capital, as well as discount factors and income tax rates are subject to a high degree of judgement and complexity. We make every effort to forecast future financial performance as accurately as possible with the information available at the time the forecast is developed. These assumptions were reviewed by management and compared to assumptions used in prior analyses and were deemed reasonable. There were no material changes in the key assumptions during the periods presented. There are inherent uncertainties and management judgement required in these determinations and risks to the forecast included but are not limited to program/product execution, transition from development to production programs, industry related make-buy decisions, and global market conditions. Changes in these estimates and assumptions could materially affect the results of our tests for goodwill impairment. We continuously monitor and evaluate relevant events and circumstances that could unfavorably impact our significant assumptions used in testing goodwill, including macroeconomic conditions, industry and market considerations, financial performance and expectations of projected financial performance and cash flows, and changes in our stock price in relation to the carrying value of its reporting units, among other relevant factors. It is possible that future changes in such circumstances, or in the inputs and assumptions used in estimating the fair value of our reporting units, could require us to perform an interim impairment assessment and record an impairment charge. In addition, we use the market approach, which compares the reporting unit to publicly traded companies and transactions involving similar businesses, to support the conclusions of the income approach. 50 Minuteman Road, Andover, Massachusetts 01810 U.S.A. | +1-(978)-256-1300 | www.mrcy.com | twitter: @MRCY During the first quarter of fiscal 2021, the Company reorganized its internal reporting unit structure to align with the Company's market and brand strategy as well as promote scale as the organization continues to grow. The Company evaluated this reorganization under ASC 280 to determine whether this change has impacted the Company's single operating and reportable segment. The Company concluded this change had no effect given the CODM continues to evaluate and manage the Company on the basis of one operating and reportable segment. The Company utilized the management approach for determining its operating segment in accordance with ASC 280. There has been no changes to the Company's conclusion of one operating and reportable segment in fiscal 2023. In accordance with FASB ASC 350, Intangibles-Goodwill and Other (“ASC 350”), the Company determines its reporting units based upon whether discrete financial information is available, if management regularly reviews the operating results of the component, the nature of the products offered to customers and the market characteristics of each reporting unit. A reporting unit is considered to be an operating segment or one level below an operating segment also known as a component. Component level financial information is reviewed by management across two divisions: Microelectronics, and Mission Systems. Accordingly, these were determined to be the Company's reporting units. As part of our annual goodwill impairment testing, we utilized a discount rate for each of our reporting units, as defined by ASC 350, that we believe represents the risks that our businesses face, considering their sizes, the current economic environment, and other industry data we believe is appropriate. The discount rates for Microelectronics and Mission Systems were 11.25%, and 12.0%, respectively. The annual testing indicated that the fair values of our Microelectronics and Mission Systems reporting units exceeded their carrying values, and thus no further testing was required. We also review finite-lived intangible assets and long-lived assets when indications of potential impairment exist, such as a significant reduction in undiscounted cash flows associated with the assets. Should the fair value of our finite-lived intangible assets or long-lived assets decline because of reduced operating performance, market declines, or other indicators of impairment, a charge to operations for impairment may be necessary. **** If the Staff has any questions, additional comments or wishes to discuss the responses provided above at any time, please do not hesitate to contact me at (978) 967-1991, or Douglas Munro, Vice President, Chief Accounting Officer at (978) 967-1222. /s/ David E. Farnsworth David E. Farnsworth Executive Vice President, Chief Financial Officer Cc: Claire Erlanger, U.S. Securities and Exchange Commission Kevin Woody, U.S. Securities and Exchange Commission Bryan, S. Keighery, Morgan, Lewis & Bockius LLP

One letter for all the questions, without numbered answers. Read the reply
In its next report

First report after the company's reply of Feb 14, 2024: 10-Q filed May 7, 2024 ↗, against the 10-Q filed Nov 7, 2023 ↗.

Tickdelta does not hold the text of both reports, so they are not compared here.
Contract Assets, page 57
SEC asked (2)
We note your disclosure that the contract asset balance increased due to growth in revenue recognized under contracts, as well as the timing of program milestone billings during the fiscal year ended June 30, 2023. Please revise future filings to quantify each of the significant changes in the balance.
Rest of the question

Also, disclose the nature and status of amounts representing claims or other similar items subject to uncertainty concerning their determination or ultimate realization, and any amounts that are expected to be billed/collected after one year. See guidance in ASC 606-10-50-10 and Rule 5-02(3)(c) of Regulation S-X.

MRCY answered

See the reply above.

In its next report

First report after the company's reply of Feb 14, 2024: 10-Q filed May 7, 2024 ↗, against the 10-Q filed Nov 7, 2023 ↗.

Tickdelta does not hold the text of both reports, so they are not compared here.

Note G. Goodwill, page 66
SEC asked (3)
We note your disclosure that you performed the annual goodwill impairment test in the fourth quarter of fiscal 2023 with no impairment noted. Given the significance of your goodwill balance and overall decline in your market capitalization, as well as deteriorating operating results, please revise your notes to the financial statements in future filings to address the following: • Provide a discussion of how
Rest of the question

goodwill and other intangible assets were tested in 2023, including whether you performed a qualitative and/or quantitative test; • Expand your disclosure to state whether or not the fair value of your reporting units "substantially exceeds" the carrying value. To the extent any reporting unit fair values are not substantially in excess of fair values, disclose the name of those reporting units and the amount or percentage by which the fair value exceeds their carrying value; • Explain how you consider market capitalization in determining the estimated fair values of the reporting units. Refer to ASC-350-20-35-3C; Additionally, please revise your disclosure in the Critical Accounting Policies section of MD&A to provide a more detailed description of the key assumptions you used to estimate fair value of the reporting units during your impairment analysis, including how the key assumptions were determined, and to discuss the degree of uncertainty associated with the key assumptions, including material changes in the key assumptions during the periods presented. Please provide us with a copy of your intended disclosure.

MRCY answered

See the reply above.

In its next report

First report after the company's reply of Feb 14, 2024: 10-Q filed May 7, 2024 ↗, against the 10-Q filed Nov 7, 2023 ↗.

Tickdelta does not hold the text of both reports, so they are not compared here.

Also in this review: closing letter, 2024-02-20
Form 10-K for the Fiscal Year Ended July 2, 2020

2021-02-25 to 2021-03-10 · 2 questions · 1 letter from the SEC, 1 from the company
Review closed 2021-03-10
Results discussion (MD&A)Goodwill and impairment
Results of Operations · Fiscal 2020 Vs. Fiscal 2019, page 36
SEC asked (1)
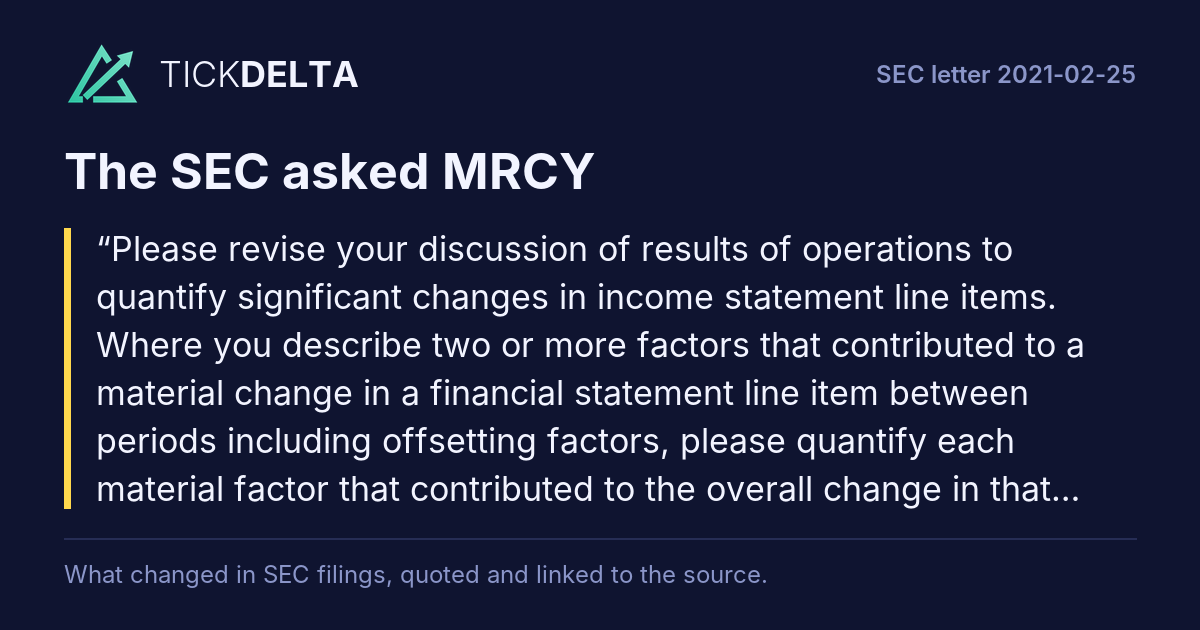
Please revise your discussion of results of operations to quantify significant changes in income statement line items. Where you describe two or more factors that contributed to a material change in a financial statement line item between periods including offsetting factors, please quantify each material factor that contributed to the overall change in that line item.
Rest of the question

Refer to Item 303 of Regulation S-K and Section III.D of SEC Release No. 336835.

MRCY answered
We acknowledge the Staff’s comment and propose to include the requested information quantifying significant changes and any offsetting factors in our income statement line items in future filings. Our future filings will include disclosure describing and quantifying factors that contribute to material changes in each financial statement line item between periods in accordance with Item 303 of Regulation S-K and Section III.D of SEC Release No. 33-6835.

50 Minuteman Road, Andover, Massachusetts 01810 U.S.A.
Rest of the answer

| +1-(978)-256-1300 | www.mrcy.com | twitter: @MRCY

Below is an example of what we intend to disclose in future filings which includes the additional quantifying factors which contribute to material changes for the discussion on the Results of Operations using our Form 10-K for the Fiscal Year Ended July 3, 2020.

Prior Disclosure:

REVENUES

Total revenues increased $141.9 million, or 22%, to $796.6 million during fiscal 2020 compared to $654.7 million during fiscal 2019 including “acquired revenue” which represents net revenue from acquired businesses that have been part of Mercury for completion of four full quarters or less (and excludes any intercompany transactions). After the completion of four fiscal quarters, acquired businesses will be treated as organic for current and comparable historical periods. The increase in total revenue was primarily due to $91.4 million and $50.5 million of organic revenues and acquired revenues, respectively. These increases were driven by higher demand throughout all product groupings, especially integrated subsystems, across all end applications and, in particular, radar, within the airborne, naval and land platforms. The increase in total revenues is primarily attributed to higher revenues associated with the P8, SEWIP and AIDEWS programs. Acquired revenue represents activity from the Germane, GECO, Athena, Syntonic and APC acquired businesses. See the Non-GAAP Financial Measures section for a reconciliation to our most directly comparable GAAP financial measures.

International revenues, which consist of foreign military sales through the U.S. government, sales to prime defense contractor customers where the end user is known to be outside of the U.S., and direct sales to non-U.S. based customers, increased $18.1 million to $91.9 million during fiscal 2020 compared to $73.8 million during fiscal 2019. International revenues represented 11.5% and 11.3% of total revenues during fiscal 2020 and 2019, respectively.

GROSS MARGIN

Gross margin was 44.8% for fiscal 2020, an increase of 110 basis points from 43.7% in fiscal 2019. The higher gross margin was primarily driven by program mix, including a higher volume of secure processing programs, and operational efficiencies, including higher utilization. These gross margin improvements were partially offset by a higher volume of Customer Funded Research and Development (“CRAD”), COVID related expenses and $1.1 million of additional inventory step-up amortization, as compared to fiscal 2019. CRAD primarily represents engineering labor associated with long-term contracts for customized development, production and service activities. These products are predominately grouped within integrated subsystems and, to a lesser extent, modules and sub-assemblies.

SELLING, GENERAL AND ADMINISTRATIVE

Selling, general and administrative expenses increased $21.6 million, or 20.0%, to $132.3 million during fiscal 2020 as compared to $110.7 million during fiscal 2019. The increase was primarily related to additional headcount from organic growth and our recent acquisitions as well as COVID related expenses. Selling, general and administrative expenses decreased as a percentage of revenue to 16.6% during fiscal 2020 from 16.9% during fiscal 2019 evidencing improved operating leverage.

RESEARCH AND DEVELOPMENT

Research and development expenses increased $29.6 million, or 43.0%, to $98.5 million during fiscal 2020, as compared to $68.9 million for fiscal 2019. The increase was primarily related to additional headcount from organic growth and our recent acquisitions as well as COVID related expenses, which was partially offset by a higher volume of CRAD. Research and development expenses accounted for 12.4% and 10.5% of our revenues during fiscal 2020 and fiscal 2019, respectively. The increase as a percentage of revenue was primarily driven by the continued investment in internal R&D during fiscal 2020 to promote the future growth of the business.

AMORTIZATION OF INTANGIBLE ASSETS

Amortization of intangible assets increased $2.7 million to $30.6 million during fiscal 2020, as compared to $27.9 million for fiscal 2019, primarily due to the acquisition of APC and the full year impact of amortization from our fiscal 2019 acquisitions.

RESTRUCTURING AND OTHER CHARGES

Restructuring and other charges were $1.8 million during fiscal 2020, as compared to $0.6 million in fiscal 2019. The increase was primarily driven by severance costs for separation of 20 employees during fiscal 2020. Restructuring and other charges are typically related to acquisitions and organizational redesign programs initiated as part of discrete post-acquisition integration activities.

ACQUISITION COSTS AND OTHER RELATED EXPENSES

Acquisition costs and other related expenses were $2.7 million during fiscal 2020, as compared to $1.5 million during fiscal 2019. The acquisition costs and other related expenses incurred during fiscal 2020 were related to the acquisition of APC, as well as costs associated with our evaluation of other acquisition opportunities. We expect to incur acquisition costs and other related expenses periodically in the future as we continue to seek acquisition opportunities to expand our technological capabilities and especially within the sensor and effector and C4I markets. Transaction costs incurred by the acquiree prior to the consummation of an acquisition would not be reflected in our historical results of operations.

INTEREST INCOME

Interest income increased to $2.2 million in fiscal 2020 from $0.9 million in fiscal 2019, due to higher average balances of cash on hand, as compared to fiscal 2019.

INTEREST EXPENSE

Interest expense for fiscal 2020 decreased $8.1 million to $1.0 million, as compared to $9.1 million in fiscal 2019. We drew $200.0 million against the Revolver during the third quarter of fiscal 2020 to provide access to capital and flexibility in managing operations during this time of uncertainty due to the outbreak of COVID. We paid down the $200.0 million draw during the fourth quarter of fiscal 2020 as a result of the reduced turbulence in capital markets. Fiscal 2019 included interest expense related to borrowings on the Revolver from our acquisitions, prior to the pay down of the balance on the Revolver with the net proceeds generated by our follow-on equity offering during the fourth quarter of fiscal 2019.

OTHER INCOME (EXPENSE), NET

Other income (expense), net was $1.7 million of other income during fiscal 2020, as compared to $8.9 million of other expense in fiscal 2019. The increase was primarily due to $6.4 million of other investment income partially offset by $0.6 million of additional litigation and settlement expenses. Fiscal 2019 included $5.4 million in other expense associated with the termination of the interest rate swap in conjunction with the pay down of the balance on the Revolver with the net proceeds generated by our follow-on equity offering to during the fourth quarter of fiscal 2019.

INCOME TAXES

We recorded an income tax provision of $8.2 million and $12.8 million on income before income taxes of $93.9 million and $59.5 million for fiscal years 2020 and 2019, respectively. We recognized a discrete tax benefit of $7.3 million and $2.7 million related to excess tax benefits on stock-based compensation for fiscal years 2020 and 2019, respectively. We also recognized a tax benefit of $6.3 million and a tax reserve of $2.2 million related to research and development tax credits claimed on prior year Federal and state tax returns and recognized a tax benefit for other favorable provision to return adjustments of $2.9 million.

The effective tax rate for fiscal 2020 and 2019 differed from the Federal statutory rate of 21% primarily due to Federal and state research and development tax credits, excess tax benefits related to stock compensation, a modified territorial tax system and a minimum tax on certain foreign earnings, and state taxes.

Within the calculation of our annual effective tax rate we have used assumptions and estimates that may change as a result of future guidance and interpretation from the Internal Revenue Service. These changes could have a material impact on our future U.S. tax expense.

Revised Disclosure:

Total revenues increased $141.9 million, or 22%, to $796.6 million during fiscal 2020 compared to $654.7 million during fiscal 2019 including “acquired revenue” which represents net revenue from acquired businesses that have been part of Mercury for completion of four full quarters or less (and excludes any intercompany transactions). After the completion of four fiscal quarters, acquired businesses will be treated as organic for current and comparable historical periods. The increase in total revenue was primarily due to $91.4 million and $50.5 million of organic revenues and acquired revenues, respectively. These increases were driven by higher demand throughout all product groupings, especially integrated subsystems which increased $78.9 million or 27%. The increase in total revenue was across all end applications and, in particular, radar and electronic warfare ("EW") which increased $69.9 million or 43% and $32.9 million or 26%, respectively. Within platforms, the increase was predominately within airborne which grew $96.3 million or 31% during fiscal 2020. The largest program increases were related to the P8, SEWIP, and AIDEWS programs. There were no programs comprising 10% or more of our revenues for the years ended July 3, 2020 or June 30, 2019. Acquired revenue represents activity from the Germane, GECO, Athena, Syntonic and APC acquired businesses. See the Non-GAAP Financial Measures section for a reconciliation to our most directly comparable GAAP financial measures.

International revenues, which consist of foreign military sales through the U.S. government, sales to prime defense contractor customers where the end user is known to be outside of the U.S., and direct sales to non-U.S. based customers, increased $18.1 million to $91.9 million during fiscal 2020 compared to $73.8 million during fiscal 2019. International revenues represented 11.5% and 11.3% of total revenues during fiscal 2020 and 2019, respectively.

Gross margin was 44.8% for fiscal 2020, an increase of 110 basis points from 43.7% in fiscal 2019. The higher gross margin was primarily driven by program mix, including a higher volume of secure processing programs, and operational efficiencies, including higher utilization driven by the increase in revenues. These gross margin improvements were partially offset by increased Customer Funded Research and Development (“CRAD”) of $2.6 million, COVID related expenses of $1.7 million, and additional inventory step-up amortization of $1.1 million, as compared to fiscal 2019. CRAD primarily represents engineering labor associated with long-term contracts for customized development, production and service activities. These products are predominately grouped within integrated subsystems and, to a lesser extent, modules and sub-assemblies.

Selling, general and administrative expenses increased $21.6 million, or 20.0%, to $132.3 million during fiscal 2020 as compared to $110.7 million during fiscal 2019. The increase was primarily related to $20.6 million of employee related compensation especially as a result of additional headcount spend from organic growth and our recent acquisitions. In addition, we incurred $1.0 million of COVID related expenses. Selling, general and administrative expenses decreased as a percentage of revenue to 16.6% during fiscal 2020 from 16.9% during fiscal 2019 evidencing improved operating leverage.

Research and development expenses increased $29.6 million, or 43.0%, to $98.5 million during fiscal 2020, as compared to $68.9 million for fiscal 2019. The increase was primarily related to $22.0 million of employee related compensation especially as a result of additional headcount spend from organic growth and our recent acquisitions. In addition, we incurred $0.3 million of COVID related expenses. These increases were partially offset by increased CRAD of $2.6 million. Research and development expenses accounted for 12.4% and 10.5% of our revenues during fiscal 2020 and fiscal 2019, respectively. The increase as a percentage of revenue was primarily driven by the continued investment in internal R&D during fiscal 2020 to promote the future growth of the business.

Amortization of intangible assets increased $2.7 million to $30.6 million during fiscal 2020, as compared to $27.9 million for fiscal 2019, primarily due to the acquisition of APC and the full year impact of amortization from our fiscal 2019 acquisitions.

Restructuring and other charges were $1.8 million during fiscal 2020, as compared to $0.6 million in fiscal 2019. The increase was primarily driven by severance costs for separation of 20 employees during fiscal 2020. Restructuring and other charges are typically related to acquisitions and organizational redesign programs initiated as part of discrete post-acquisition integration activities.

Acquisition costs and other related expenses were $2.7 million during fiscal 2020, as compared to $1.5 million during fiscal 2019. The acquisition costs and other related expenses incurred during fiscal 2020 were related to the acquisition of APC, as well as costs associated with our evaluation of other acquisition opportunities. We expect to incur acquisition costs and other related expenses periodically in the future as we continue to seek acquisition opportunities to expand our technological capabilities and especially within the sensor and effector and C4I markets. Transaction costs incurred by the acquiree prior to the consummation of an acquisition would not be reflected in our historical results of operations.

Interest income increased to $2.2 million in fiscal 2020 from $0.9 million in fiscal 2019, due to higher average balances of cash on hand, as compared to fiscal 2019.

Interest expense for fiscal 2020 decreased $8.1 million to $1.0 million, as compared to $9.1 million in fiscal 2019. We drew $200.0 million against the Revolver during the third quarter of fiscal 2020 to provide access to capital and flexibility in managing operations during this time of uncertainty due to the outbreak of COVID. We paid down the $200.0 million draw during the fourth quarter of fiscal 2020 as a result of the reduced turbulence in capital markets. Fiscal 2019 included interest expense related to borrowings on the Revolver from our acquisitions, prior to the pay down of the balance on the Revolver with the net proceeds generated by our follow-on equity offering during the fourth quarter of fiscal 2019.

Other income (expense), net was $1.7 million of other income during fiscal 2020, as compared to $8.9 million of other expense in fiscal 2019. The increase was primarily due to $6.4 million of other investment income partially offset by $0.6 million of additional litigation and settlement expenses. Fiscal 2019 included $5.4 million in other expense associated with the termination of the interest rate swap in conjunction with the pay down of the balance on the Revolver with the net proceeds generated by our follow-on equity offering to during the fourth quarter of fiscal 2019.

We recorded an income tax provision of $8.2 million and $12.8 million on income before income taxes of $93.9 million and $59.5 million for fiscal years 2020 and 2019, respectively. We recognized a discrete tax benefit of $7.3 million and $2.7 million related to excess tax benefits on stock-based compensation for fiscal years 2020 and 2019, respectively. We also recognized a tax benefit of $6.3 million and a tax reserve of $2.2 million related to research and development tax credits claimed on prior year Federal and state tax returns and recognized a tax benefit for other favorable provision to return adjustments of $2.9 million.

The effective tax rate for fiscal 2020 and 2019 differed from the Federal statutory rate of 21% primarily due to Federal and state research and development tax credits, excess tax benefits related to stock compensation, a modified territorial tax system and a minimum tax on certain foreign earnings, and state taxes.

Within the calculation of our annual effective tax rate we have used assumptions and estimates that may change as a result of future guidance and interpretation from the Internal Revenue Service. These changes could have a material impact on our future U.S. tax expense.

Comment 2:

Read in the reply
In its next report

First report after the company's reply of Mar 9, 2021: 10-Q filed May 11, 2021 ↗, against the 10-Q filed Feb 9, 2021 ↗.

Tickdelta does not hold the text of both reports, so they are not compared here.

Notes to Consolidated Financial Statements · G. Goodwill, page 70
SEC asked (2)
Your disclosure indicates that you have provided the changes in goodwill by reporting unit. However, we note disclosure only at a consolidated level rather than a reporting unit level. Please revise to provide goodwill by reporting unit as indicated on page 70 or revise your statement accordingly.
MRCY answered
We acknowledge the Staff’s comment and propose to revise our disclosure to indicate that the carrying amount of goodwill is at the consolidated level rather than a reporting unit level in each of our future filings.

****

If the Staff has any questions, additional comments or wishes to discuss the responses provided above at any time, please do not hesitate to contact me at (978) 967-1990, or Michelle McCarthy, Vice President, Chief Accounting Officer at (978) 967-1737.
Read in the reply
In its next report

First report after the company's reply of Mar 9, 2021: 10-Q filed May 11, 2021 ↗, against the 10-Q filed Feb 9, 2021 ↗.

Tickdelta does not hold the text of both reports, so they are not compared here.

Also in this review: closing letter, 2021-03-10

Form 10-K for the Fiscal Year Ended June 30, 2016

2017-01-05 to 2017-03-01 · 9 questions · 3 letters from the SEC, 3 from the company
Review closed 2017-03-01
SegmentsNon-GAAP measuresGoodwill and impairmentRevenueAcquisitions
Operations · Non-GAAP Financial Measures, page 40
SEC asked (1)
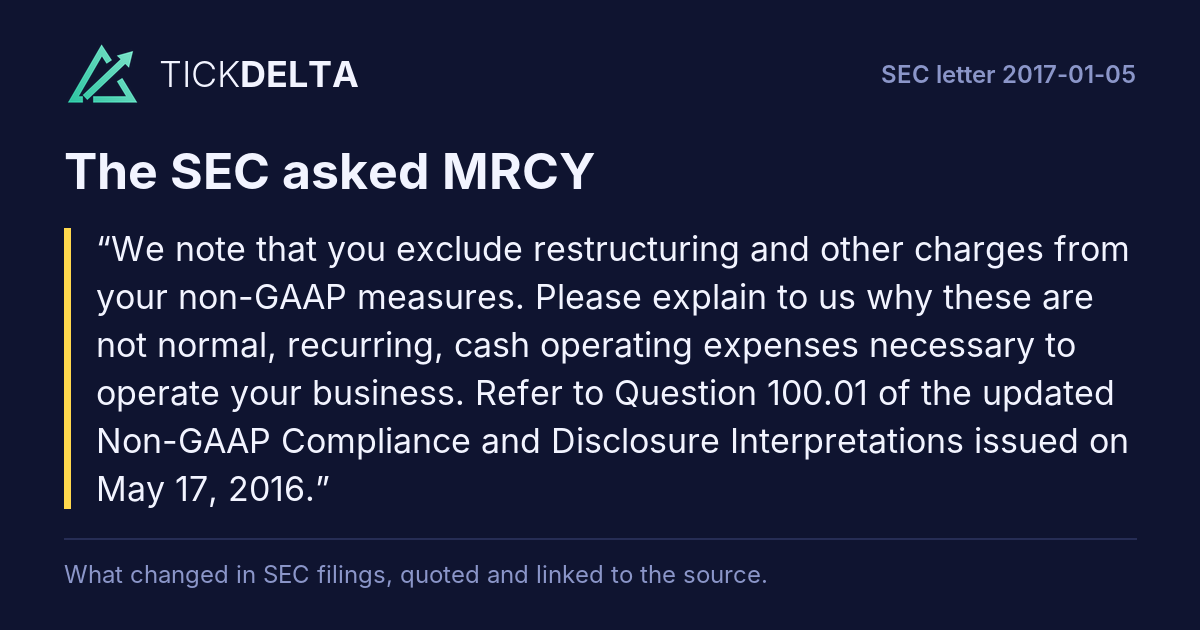
We note that you exclude restructuring and other charges from your non-GAAP measures. Please explain to us why these are not normal, recurring, cash operating expenses necessary to operate your business. Refer to Question 100.01 of the updated Non-GAAP Compliance and Disclosure Interpretations issued on May 17, 2016.
MRCY answered
In response to the Staff’s comment, we have referred to Question 100.01 of the updated Non-GAAP Compliance and Disclosure Interpretations issued on May 17, 2016 and have concluded that the adjustment for restructuring and other charges are not normal and recurring as contemplated in the foregoing interpretations. The Company’s adjustments reflected in restructuring and other charges are almost entirely related to acquisitions and organizational redesign programs initiated as part of discrete post-acquisition integration activities.
Rest of the answer

Following certain acquisitions, the Company initiates discrete restructuring programs in connection with the integration of the acquired businesses to eliminate duplicative positions, facilities, and other redundant costs. Although the Company historically realigned operating expenses through general workforce reductions unrelated to acquisitions, no such general (i.e. non-discrete acquisition related) business restructurings occurred during the three year period covered by the Form 10-K (fiscal 2014-2016).

201 Riverneck Road • Chelmsford, MA 01824 • 866.627.6951 • mrcy.com

Restructuring and other charges are primarily related to permanent reductions in the workforce of acquired businesses, termination of third party contracts, other exit costs and related charges as a result of business acquisitions and associated organizational redesign programs which are reflected in the historical results for a relatively short, discrete period of time. The costs associated with these discrete programs vary significantly in size and frequency and thereby create significant volatility in the historical results, as well as a lack of direct comparability due to the often differing composition of those costs. By excluding these costs, supplemental information is being provided for investors to better analyze the ongoing operating performance of the Company. For instance, the costs associated with restructuring programs were $1.2 million, $3.2 million and $5.4 million in fiscal years 2016, 2015 and 2014, respectively, of which more than 98% in total are related to post-acquisition integration activities. Additionally, the downward trend is consistent with our internal integration timeline. We do not expect to incur future restructuring and other charges, unless we have additional acquisitions in the future, which is unpredictable. Further, any such restructuring costs will vary dramatically depending on the nature and size of the acquisition. In addition, these costs are not used for an assessment of the long-term performance of the Company or the sustainability of our results. Most importantly, the elimination of these costs from Non-GAAP measures does not result in a reduction of ongoing operating expenses necessary to conduct our business on a continuing basis. As such, the Company believes that the exclusion of restructuring and other charges from certain Non-GAAP financial measures provides supplemental information that enables Company management and its investors to better analyze and compare the Company’s ongoing operating performance from period to period.

In accordance with the Staff’s comment, in future filings, the Company will enhance its disclosures related to the adjustment of restructuring and other charges in the Non-GAAP Financial Measures section.

Comment 2:

Read in the reply
In its next report

First report after the company's reply of Jan 11, 2017: 10-Q filed Feb 9, 2017 ↗, against the 10-Q filed Nov 3, 2016 ↗.

Tickdelta does not hold the text of both reports, so they are not compared here.

Operations · Non-GAAP Financial Measures, page 40
SEC asked (2)
Refer to the table on page 41 and footnote (2). Also refer to similar disclosure on page 22 of your September 30, 2016 Form 10-Q. Please tell us how you determined the effect to your tax provision of the items added back in determining adjusted EBITDA. Refer to Question 102.11 of the updated Non-GAAP Compliance and Disclosure Interpretations issued on May 17, 2016 when preparing your next filing and earnings release.
MRCY answered
In response to the Staff’s comment, the Company has determined that adjusted income from operations, as calculated in the table on page 41 and footnote (2) of our Form 10-K for the fiscal year ended June 30, 2016 and on page 22 of our September 30, 2016 Form 10-Q, is a performance measure. In accordance with the guidance in Question 102.11, the Company calculates the tax effect of the add-backs used in determining adjusted income from operations by calculating the current and deferred tax impact of those add-backs.
Rest of the answer

The Company recasts its income (loss) from operations before income taxes to include the add-backs and recalculates the income tax provision using this adjusted income (loss) from operations before income taxes. The adjusted tax provision reflects all of the relevant impacts of the add-back items, inclusive of those items that have an impact to the effective tax rate, current provision and deferred provision. As a result of the varying impacts of each item, the effective tax rate for the adjusted tax provision will vary period over period as compared to the GAAP effective tax rate. The adjusted tax provision is then compared to the GAAP tax provision, and the difference is reflected as “impact to income taxes” in the reconciliation between income from operations and adjusted income from operations.

In accordance with the Staff’s comment, in future filings the Company will enhance its disclosures related to the tax effect of the items added back in determining adjusted income from operations.

Comment 3:

Read in the reply
In its next report

First report after the company's reply of Jan 11, 2017: 10-Q filed Feb 9, 2017 ↗, against the 10-Q filed Nov 3, 2016 ↗.

Tickdelta does not hold the text of both reports, so they are not compared here.

Item 8. Financial Statements · Note P – Operating Segment, page 74
SEC asked (3)
We note your disclosure that during fiscal 2016, you completed a series of internal organizational structure changes that eliminated your previous operating segments, Mercury Commercial Electronics (“MCE”) and Mercury Defense Systems (“MDS”).
Rest of the question

So that we may further understand the changes made, please provide us with sufficient information describing the changes made which resulted in the elimination of your MCE and MDS operating segments and your determination that you have only one operating segment. Please address the following:  Describe the role of the CODM and each of the individuals who report to the CODM.  Describe the information regularly provided to the CODM, how frequently it is prepared and how it changed during fiscal 2016.  Describe the specific changes to the allocation of resources and assessment of performance by the CODM.  Describe how your organizational changes impacted your reporting unit structure for goodwill testing purposes. In this regard, we note that you continue to allocate goodwill to your MCE and MDS reporting units.

MRCY answered
In response to the Staff’s comment, the Company has provided you with the information below describing the changes made which resulted in the elimination of our former MCE and MDS operating segments and our determination that we have only one operating segment. Additionally we address below the following questions from the Staff:

Describe the information regularly provided to the CODM, how frequently it is prepared and how it changed during fiscal 2016.

Describe how your organizational changes impacted your reporting unit structure for goodwill testing purposes.
Rest of the answer

In this regard, we note that you continue to allocate goodwill to your MCE and MDS reporting units.

At the beginning of May, 2016 (the fourth quarter of Mercury’s fiscal 2016), the Company’s chief operating decision maker (“CODM”) ceased reviewing the results of our former MCE and MDS operating segments. As discussed in more detail below, since that time, the CODM has utilized only the total Company’s consolidated results to make decisions and allocate resources in accordance with the criteria of Paragraph 280-10-50-1 of ASC 280, and the Company now has no other operating segment that meets these criteria.

Background

Beginning approximately 18 months ago, following a series of acquisitions, the Company made significant and important organizational changes to align and scale Mercury into one business, which ultimately resulted in the Company adopting the term “One Mercury” to describe its strategic approach. These changes included the implementation of centralized operating functions such as sales, engineering, program management, and quality assurance, as well as centralized administrative functions including legal, accounting, human resources, marketing and information technology. In addition, during fiscal 2016, Mercury completed the largest acquisition in its history, the $300 million acquisition of the Embedded Security, RF and Microwave, and Custom Microelectronics businesses of Microsemi Corporation, which is referred to hereafter as the “Microsemi carve-out”. Integration of the Microsemi carve-out commenced immediately upon completion of the acquisition and involved elements spanning all of Mercury’s existing capabilities, product lines and functional areas of the business. These internal organizational changes, completed acquisitions, and extensive acquisition integration activities were executed to support the Company’s strategy of creating a better alternative for affordable, secure sensor processing subsystems designed and made in the USA.

Additionally, one of the core tenets of the Company’s strategy has been the continued expansion of its technological capabilities and program content along the sensor processing chain. With the expansion of these capabilities and related organizational changes, Mercury now provides integrated subsystem solutions to its customers, involving technologies and products sourced from formerly distinct parts of Mercury’s business in such a way that the former distinctions between the MCE and MDS operating segments no longer exist. Mercury now provides solutions to common customers (Department of Defense and the Defense prime contractors and subcontractors), common markets (Radar, Electronic Warfare, C4I (Command, Control, Compute, Communicate, Intelligence) and Mission Control) with common products (RF and Microwave, mixed signal, storage, processing, and radar simulation, all supported by horizontal secure processing solutions, or SPS, layer consisting of software and firmware) and common manufacturing techniques (surface mount technology, or SMT, chip and wire, through-hole, test and tune, and integration). These manufacturing techniques, and the supporting technologies, systems and infrastructure are not unique to a single facility, but are common across our manufacturing facilities located in Hudson, NH, West Caldwell, NJ, Manteca, CA, Camarillo, CA and Phoenix, AZ and are supported by our technology centers for final test, tune, assembly and integration to fulfill the various subsystems along the sensor processing chain.

Overall, the Company’s “One Mercury” go-to-market strategy has resulted in the ability to provide a variety of product capabilities to our customers, often integrated together on the same subsystem. Further, while there were no wholesale changes to the internal management of the Company, there were multiple managerial realignments within the business, spanning both operational and supporting functions such as finance and accounting, marketing, human resources and others. Management decisions are now made on a consolidated level and the Company’s operations are now supported by one common infrastructure including selling, engineering, program management, quality assurance and general and administrative functions. As a result of these changes, the Company reassessed its operating segments as defined by ASC 280.

“Your determination that you have only one operating segment”

ASC 280 requires public entities to disclose certain information about reportable operating segments using the “management approach” in order to allow users of the financial statements the ability to see the business “through the eyes of management.” Therefore, information must be presented consistent with the way management internally evaluates the operating performance of its business units or segments, also called its “management reporting structure.” The management approach also allows for consistent descriptions of a public entity in its annual report and other published information, and focuses financial information on what the Company’s decision makers use to make decisions regarding operating matters. The components that management uses for that purpose are called “operating segments.”

Paragraph 280-10-50-1 of ASC 280 defines an “Operating Segment” as a component of a public entity that has all of the following characteristics:

a.

It engages in business activities from which it may earn revenues and incur expenses (including revenues and expenses relating to transactions with other components of the same public entity).

b.

Its operating results are regularly reviewed by the public entity's chief operating decision maker to make decisions about resources to be allocated to the segment and assess its performance.

c.

Its discrete financial information is available.

The Company evaluated each of the three characteristics.

Our analysis of characteristic “a” noted that any component of Mercury’s business, however defined, engages in business activities that are designed to earn revenues and incur expenses. Accordingly, for purposes of this analysis, the criterion is met.

With respect to characteristic “b”, the Company’s consolidated operating results are regularly reviewed by the CODM, our President and Chief Executive Officer (“CEO”). However, as discussed in the analysis below, the CODM does not regularly review such information for other smaller elements within the overall business. Accordingly, for purposes of this analysis, the criterion is met only on a fully consolidated, total Company basis.

Regarding characteristic “c”, the Company has the ability to compile discrete financial information at both the legal entity and product line levels. While the Company does not believe financial information by legal entity and product line are meaningful measures of profit/loss, they are technically measures of profit/loss, and therefore we believe they meet the spirit of “discrete” financial information as defined in ASC 280. Discrete financial information is available by legal entity, but as noted above it is not particularly meaningful, and is only maintained for federal and state tax reporting requirements and Defense Contract Auditing Agency (“DCAA”) compliance purposes. Similarly, product line financial information is also used for DCAA compliance purposes. Financial information by legal entity and product line are not used by the CODM to manage the business, as discussed below.

Accordingly, the Company determined that it is comprised of one operating segment because all three criteria are satisfied only at the consolidated total Company level.

The CODM is Mercury’s CEO. In addition to: (i) being responsible for the strategic decisions of the Company, and (ii) having the ultimate decision-making authority, the CEO also has the sole authority to allocate resources and to assess the operating results of Mercury.

The CEO has eight direct reports: Chief Operating Officer (“COO”), EVP and Chief Financial Officer, VP and Chief Marketing Officer, VP and Chief Information Officer, VP and Chief Human Resources Officer, Senior VP & General Counsel, Senior VP Strategy & Corporate Development, and an Executive Assistant.

The Company also evaluated whether the role of CODM could be considered a management committee per ASC 280. While various members of senior management provide inputs to the CEO, the concept of a voting management structure does not exist at the Company. The CEO makes all final decisions when it comes to assessment of performance and making resource allocation decisions.

Hence the Company’s CEO is our CODM.

Describe the information regularly provided to the CODM, how frequently it is prepared and how it changed during fiscal 2016.

As a result of a series of organizational changes, culminating with the Microsemi carve-out acquisition, the information regularly provided to the CODM changed in May of 2016.

The CODM uses the monthly Executive Board (“EB”) deck, quarterly Board (“BOD”) deck and annual and mid-year strategic operating plan (“SOP”) when assessing Company performance.

The EB deck is a presentation that is reviewed each month by the CODM and is also used as the basis for the discussion at the monthly EB meeting. The EB is comprised of the CEO, the CEO’s direct reports as well as a small number of other senior managers. The EB deck includes full income statement and adjusted EBITDA presentations at the consolidated Mercury level, both with and without the results of its most recent acquisitions. Prior to the acquisition of the Microsemi carve-out in May 2016, the EB deck included financial results by our former operating segments (i.e., MCE and MDS). Starting in May 2016, the MCE and MDS distinction was removed for all of the reasons set forth above. The separate presentation of financial information related to recently acquired businesses in the EB deck is solely included so the CODM can monitor organic performance against budget, guidance and analysts’ expectations as these are often set prior to, and therefore without the impact of, acquired businesses. The information within the EB deck relating to businesses acquired by Mercury is not used by the CODM to make business decisions or allocate resources. The inclusion is solely for the CODM to have a data source to respond to questions about the recently completed acquisition(s) until they are more fully integrated into Mercury as a whole. In fact, the July 2016 EB deck no longer separated organic Mercury from the financial information relating to the recently acquired Microsemi carve-out business for the fiscal 2017 forecast. Similar to prior acquisitions, the availability of separate financial information for the Microsemi carve-out business has been phased out during fiscal 2017 as the Company completes the integration onto a common Enterprise Resource Planning system and separate legal entities are dissolved or merged out of existence over time. Again, the CODM uses only consolidated total Mercury-wide results to make business decisions.

The monthly EB deck also includes revenue and/or bookings by the Company’s product lines, end markets, programs, platforms, and customers. These metrics are provided in order to provide a full understanding of the Company’s performance surrounding the entire sensor processing chain. Each of these metric presentations show a different view of revenue, and discrete financial information is not presented for these product lines within the EB deck. The CODM focuses on total Company results and programs when making business decisions and allocating resources. Many of the Company’s programs cross into multiple product lines. Income statement information is presented only at the total Company consolidated level.

The CODM also receives a quarterly BOD deck, annual SOP, and a mid-year update to the SOP. The quarterly BOD deck includes similar information to the EB deck; however there is less financial information in these materials, which instead focus heavily on operational aspects, including programs, product lines, and market updates. Only total Company financial information is presented.

In assessing the business “through the eyes of management,” we also reviewed recent information presented to securities analysts, information included in CEO and CFO scripts, press releases, and information on the Company’s website. The information included in these materials is consistent with the information included in the Company’s EB deck.

To conclude, total Company consolidated financial information and revenues/bookings by product lines, end markets, programs, platforms and customers constitutes the information regularly reviewed by the CODM to make business decisions and allocate resources. This information is provided to the CODM on a monthly, quarterly, semi-annual, and annual basis as discussed above.

As discussed above, in May, 2016 the CODM began using total Company consolidated financial information to assess performance and allocate resources. The Company’s EB deck, BOD deck and SOP were also revised and only include financial information at a consolidated level, consistent with the way that the CODM evaluates the business and discusses the business externally with investors and securities analysts.

Describe how your organizational changes impacted your reporting unit structure for goodwill testing purposes. In this regard, we note that you continue to allocate goodwill to your MCE and MDS reporting units.

The Company’s organizational changes in fiscal 2016 added a new reporting unit for goodwill testing purposes: the Microsemi carve-out (referred to as the “Carve-Out Business” in our Form 10-K for the Fiscal Year Ended June 30, 2016.)

The Company assessed how the change in operating segments discussed above affected our reporting units used for impairment testing of goodwill. A reporting unit is defined by ASC 350-20-20 as “the level of reporting at which goodwill is tested for impairment. A reporting unit is an operating segment or one level below an operating segment (also known as a component).” ASC 350-20-35-34 states, “a component of an operating segment is a reporting unit if the component constitutes a business or a nonprofit activity for which discrete financial information is available and segment management, as that term is defined in paragraph 280-10-50-7, regularly reviews the operating results of that component.”

The Company has concluded it is one operating segment as discussed above. One level below this single operating segment is our legal entities or components. The Company’s product lines are in turn one level below the legal entity or component level. The Company has discrete financial information by product line and by legal entity. However, as noted above this financial information is not reviewed by the CODM to make decisions about resources or assess operational performance. This is evidenced by the exclusion of legal entity and product line financial information (other than revenue and bookings as discussed above) from the monthly EB deck, quarterly BOD deck, and the annual/mid-year SOP.

The principal difference between ASC 280 (Segment Reporting) and ASC 350 (Intangibles - Goodwill and Other) is that reporting units for goodwill impairment testing purposes are determined at a level below the operating segment level (i.e., at the component level) if the discrete component financial information is reviewed by the segment manager. In the case of Mercury, the segment manager is not the CODM. The segment manager reviews component level results, which have not changed except for the addition of the Microsemi carve-out as a component of the Company. Therefore, these components are considered reporting units.

The reporting unit financial information allows the segment manager to perform a sufficient level of review commensurate with his job responsibilities which have not changed as a result of our organizational changes. Therefore, there is no impact to our reporting unit structure for goodwill impairment testing purposes.

In conclusion, our reporting units did not change as a result of our operating segments’ changes because the discrete results of our reporting units continue to be reviewed by segment management. For the reported periods, in accordance with ASC 350, the Company had three reporting units: MCE, MDS, and the Carve-Out Business.

****

The Company hereby acknowledges the following:

the Company is responsible for the adequacy and accuracy of the disclosure in the filing;

the Staff comments or changes to disclosure in response to Staff comments do not foreclose the Commission from taking any action with respect to the filing; and the Company may not assert Staff comments as a defense in any proceeding initiated by the Commission or any person under the federal securities laws of the United States.

If the Staff has any questions, additional comments or wishes to discuss the responses provided above at any time, please do not hesitate to contact me at (978) 967-1990, or Charles A. Speicher, Vice President, Controller and Chief Accounting Officer at (978) 967-1737.

Read in the reply
In its next report

First report after the company's reply of Jan 11, 2017: 10-Q filed Feb 9, 2017 ↗, against the 10-Q filed Nov 3, 2016 ↗.

Tickdelta does not hold the text of both reports, so they are not compared here.

Item 8. Financial Statements · Note P – Operating Segment, page 74
SEC asked (1)
We note from your response to comment 3 that your CEO has been identified as your CODM and that your CEO has eight direct reports including your Chief Operating Officer (“COO”). Additionally, we note that in May 2016 your CODM began using consolidated financial information to assess performance and allocate resources.
Rest of the question

To help us better understand the determination of your CODM, please address the following:  Explain how your CODM ensures resources are allocated in the most effective manner to drive the most shareholder value.  Explain what the CODM allocates between when resources are limited, and describe any information used to make those allocations.  Explain how the CODM’s role differs from his reportees in assessing performance and allocating resources and what ability the reportees have to make operating decisions affecting other reportees.  Explain the responsibilities of your COO to your business, including any role in allocating resources and assessing the performance of your business. Explain how this role, as it relates to allocating resources and assessing performance, differs from your CODM.  Tell us the other senior managers that attend the EB meeting and describe their roles.  Explain the financial information discussed in the EB meetings and the extent to which information is discussed about MCE, MDS, and the Carve-Out business reporting units.

MRCY answered
201 Riverneck Road • Chelmsford, MA 01824 • 866.627.6951 • mrcy.com

Mercury’s Response to Comment 1: In response to the Staff’s comment, the Company confirms that our Chief Executive Officer (“CEO”) is our chief operating decision maker ("CODM"). During fiscal 2016, we completed a series of important internal organizational changes in order to integrate, align and scale ourselves into a single, unified business.
Rest of the answer

In addition, over the past several years, we have completed several acquisitions, culminating with the Carve-Out business acquisition from Microsemi (“Carve-Out business”) on May 2, 2016 to support our strategy of creating a better alternative for affordable, secure processing subsystems. These strategic acquisitions and the associated operational and managerial changes finalized the transformation of the way the Company's executive management team, including the CEO as the CODM, manage, evaluate and review the business, including how he allocates resources and assesses performance. This also led to significant changes in the way we present financial information relating to the business.

Our CEO has eight direct reports, comprised of an executive assistant and seven operational executives including our Chief Financial Officer (“CFO”), Chief Operating Officer (“COO”), General Counsel, Chief Information and Integration Officer, Chief Human Resources Officer, Chief Marketing Officer, and Senior Vice President of Strategy and Corporate Development. Additionally, in May 2016, based on the significant changes to and reorganization of the underlying business, our CODM began using only consolidated financial information to assess performance and allocate resources.

Additionally we have addressed the following sub-comments from the Staff to help you better understand Mercury’s determination of our CODM:

It is the role and responsibility of the Company’s CEO (CODM) to allocate Company resources at a corporate level to ensure that our strategic, financial and operational objectives are met. Our strategy is based upon growth, both organically and through acquisitions as targets become available, as well as achieving our target business model. Our target business model is premised upon realizing operational excellence, including but not limited to the operational integration of acquired businesses, and is fundamentally dependent upon careful allocation of limited resources across various elements, functions, key projects and programs within the business. These resource allocation decisions are made by our CEO, typically in the context of his weekly staff meetings, monthly Executive Board (“EB”) meetings, or as part of our semi-annual strategic planning process. Once these decisions are made, the CEO regularly reviews project and program-level updates provided by his direct reports on the progress, timing, and operational and financial impacts of these initiatives. The CEO also reviews overall progress against the Company’s target business model, financial forecasts, external financial guidance, and various measures of operational profitability and cash flows for the business as a whole. These factors guide his decision-making process and provide a basis for evaluating the success of those decisions.

The CODM assesses the Company’s overall performance relative to internal and external expectations and measurements. The Company’s financial performance is measured against its internal budget and forecast, Strategic Operating Plan (“SOP”), internal financial forecasts, external financial guidance, securities analysts’ estimates, peer group performance and the Spade Defense Index. Additionally, the CODM studies market and industry data and subscribes to market studies in order to determine areas of market growth, product directions, and potential areas of expansion (or contraction) of investments to support his decision making process.

Explain what the CODM allocates between when resources are limited, and describe any information used to make those allocations.

As a growth company seeking to deliver results that exceed those of our peers, all resources are considered limited. The CEO (CODM) determines the allocation and balance of resources among and across different functions, product technologies, projects, programs, key initiatives and locations across the entire company, making critical decisions regarding the establishment, relative priority, timing and funding, and the associated trade-offs between these factors. This also includes decision making about investment in, and prioritization of, activities within and across centralized functions such as information technology, human resources, marketing, finance, financial planning, accounting, legal, and corporate development (mergers & acquisitions). These functions are centralized, providing support across the operations of the entire business, rather than being aligned with or reporting to any operational element or location within the business.

Examples of resource allocation and prioritization decisions that are made by the CEO (CODM) include overall personnel hiring and compensation plans, material capital expenditure projects and the associated funding, whether for business integration activities or for operational improvements or expansions, capital expenditures for facility upgrades and/or consolidations, changes in manufacturing strategy, significant research and development or new product initiatives, information technology (“IT”) initiatives, human resource initiatives such as investment in a new HRIS (Human Resource Information System), and implementation of our strategic account management sales strategy.

The CODM also uses internal financial data in deciding the allocation of resources to meet strategic, operational and financial performance objectives. This financial data, contained in the EB deck, includes consolidated revenue, bookings and design win forecasts as well as consolidated profit and loss statements and operating metrics. The CODM also periodically reviews separate project updates relating to key internal initiatives across all business operations to evaluate progress, cost, timing, and the predicted operational and financial impacts of such projects.

As mentioned in our previous response, the Company’s “One Mercury” go-to-market strategy has resulted in the ability to provide a variety of product capabilities to our customers, often integrated together into a single subsystem for which elements are provided by different product technologies and locations within the Company but under different general managers. As a result, the Company has placed a greater emphasis on key programs and customers. Therefore, the CODM also evaluates the status of these key programs and their impact on consolidated forecasts and financial and operational results when determining how to allocate resources.

Explain how the CODM’s role differs from his reportees in assessing performance and allocating resources and what ability the reportees have to make operating decisions affecting other reportees.

The CODM’s role differs from his direct reports (“reportees”) in assessing performance and allocating resources in numerous ways. The CEO (CODM) is ultimately responsible to our Board of Directors and our shareholders. He has ultimate decision making authority over all material objectives relating to strategic, operational and financial imperatives as well as the timing, priority, funding and overall resource allocations to such matters. Only the CEO (CODM) has the authority and ability to make operating decisions that affect multiple reportees. The CEO also evaluates the performance of each function and each of his reportees against specific performance objectives set out in the Company’s SOP. In comparison, his reportees are responsible for discrete areas or functions and assess the performance of only those managers who report directly to them, without any authority to make decisions affecting other reportees of the CEO or their operational areas.

The CEO (CODM) provides the strategic objectives to and defines the priorities of his reportees, with specific directives on where resources are to be deployed and utilized, and those reportees are responsible for execution against these objectives and priorities. The reportees have the ability and authority to make the tactical operating decisions, within their specific area or function, subject to certain limitations, to ensure that resource allocations and project execution are carried out to meet the strategic directives handed down to them within their established authority. In the case of conflicts, the CEO is the ultimate decision maker.

The tactical decisions of reportees are communicated through the next layer of reportees (directors and managers), who implement the decisions made within their respective roles and functions. This process is cascaded downward throughout the Company.

Explain the responsibilities of your COO to your business, including any role in allocating resources and assessing the performance of your business. Explain how this role, as it relates to allocating resources and assessing performance, differs from your CODM.

The COO is primarily responsible for managing the engineering, manufacturing and sales functions of the Company in support of the Company’s individual product technologies. The COO executes engineering and manufacturing resource allocations to support the CODM’s strategic initiatives and participates in strategic account management, business development (strategic sales), and other sales related strategies and tactics. The COO is responsible for executing certain tactical initiatives in support of strategic objectives and operational initiatives defined by the CEO (CODM), but the COO does not dictate what the strategic objectives or operational initiatives are. The COO also does not make operational or financial decisions regarding various functions that support the entire Company, such as information technology, facilities, human resources, marketing, finance, financial planning, accounting, legal, and corporate development.

The CEO (CODM) is responsible for creating the overall strategy and operational priorities of the Company, which are in turn executed by his reportees including but not limited to the COO. The CEO (CODM) also assesses the resources needed to support the overall Company’s growth strategy, the absolute and relative financial performance and achievement of its target business model, and the necessary functions, priorities and commitments to ensure that this strategy and associated operational objectives are being carried out.

Where the COO differs from the CODM is that the COO is not responsible for the overall assessment of how the Company is performing relative to its strategic, operational and financial objectives across all functions, and how resources are allocated and performance is evaluated in functions other than engineering, manufacturing and sales.

The senior managers that attend the EB meeting, and their roles, are as follows:

Executive Vice President, Chief Financial Officer: reports directly to the CEO and is responsible for the corporate finance, financial planning and analysis, accounting, tax, treasury and global order services, as well as the Company’s facilities management, security program and various compliance and risk management functions. His presentation at the EB meeting includes reporting on consolidated financial results, forecasts, and periodic performance against budget, prior forecasts, external guidance, and analysts’ consensus estimates. He also reports on key financial issues and initiatives on a consolidated basis across all of the operations of the business.

Executive Vice President, Chief Operating Officer: reports directly to the CEO and is responsible for engineering, manufacturing and sales. His presentation at the EB includes quarterly sales, product and program updates, end market and customer relationship trends and improvements, and status of key programs.

Senior Vice President, Strategy & Corporate Development: reports directly to the CEO and is responsible for the Company's corporate development activities, including strategy, planning and mergers and acquisitions (“M&A”). His presentation at the EB meeting includes key issues and initiatives within the corporate development organization including progress on any active M&A projects.

Senior Vice President, General Counsel: reports directly to the CEO and is responsible for the direction and management of the Company's legal affairs, including transactional support for mergers, acquisitions, and corporate finance; litigation, contracts and employment matters. His presentation at the EB meeting includes key issues and initiatives within the legal organization and function.

Chief Human Resources Officer: reports directly to the CEO and is responsible for driving the Company’s human resources strategy and partnering with senior leadership to design and execute a long-term human capital approach in support of Company operating goals. Her presentation at the EB meeting includes key issues, programs, and HRIS initiatives within the human resources organization and function.

Vice President, Chief Marketing Officer: reports directly to the CEO and is responsible for overseeing the development and execution of the Company’s marketing initiatives. His presentation at the EB meeting includes key issues and initiatives within the corporate marketing organization and function, including the Company’s external website, the One Mercury internal website, marketing collateral materials, interaction with industry organizations and trade shows, press releases and other forms of internal and external marketing communications.

Vice President, Chief Information and Integration Officer: reports directly to the CEO and is responsible for the Company’s full range of information technology (“IT”) initiatives and global business integration activities. In the EB meeting, he addresses questions regarding IT initiatives and the status of various Company-wide business integration efforts.

Vice President, Sales: reports to the COO and is responsible for growing and managing global revenue for the Company. His presentation at the EB meeting includes reporting of the worldwide sales forecast, design wins, and sales pipeline.

Vice President, Controller, Chief Accounting Officer: reports directly to the CFO and manages the day to day activities within the Company’s accounting operations, external financial reporting, tax and treasury. He supports the CFO’s presentation and is also in attendance to answer any questions regarding accounting, financial reporting, tax or treasury matters.

Senior Director, Corporate Financial Planning & Analysis: reports directly to the CFO and manages the day to day activities within the Company’s centralized corporate financial planning and financial analysis (“FP&A”) function, with responsibility for coordinating and consolidating business financial planning, analytics and budgeting and forecasting across all operations of the Company. His presentation at the EB meeting includes updates to the consolidated business forecast, financial trends and analytics.

Director, Internal Audit: reports directly to the Audit Committee Chair and manages the Company’s compliance with Sarbanes-Oxley and coordination of internal audit and Enterprise Risk Management activities. His attendance at the EB meeting relates primarily to his role in the Company’s Enterprise Risk Management process.

In addition, three product technology General Managers attend the EB meetings. These product technology General Managers’ report directly to the COO, and manage day to day activity within their product technologies including managing research and development spend, inventory positioning, program investments, design, quality, manufacturing operations and on time customer delivery requirements. They do not make a presentation at the EB meetings, but are there to take direction from the CODM on strategic objectives.

Explain the financial information discussed in the EB meetings and the extent to which information is discussed about MCE, MDS, and the Carve-Out business reporting units.

The financial information discussed in the EB meeting includes only: consolidated actual results, consolidated financial guidance, consolidated balance sheet trends, consolidated profit and loss trends, and consolidated cash flows; and sales forecasts by program, and revenue and bookings broken out by: customer, program, product technology, market, platform and sensor chain. The financial information in the EB meeting also includes inventory turns and capital expenditures by manufacturing site. For a limited period of time after the change to a single reporting and operating segment, the presentation prepared for EB meetings did include partial information limited to accounts receivable, deferred revenue and other cost of goods sold for the Mercury Commercial Electronics (“MCE”) and Mercury Defense Systems (“MDS”) business components. This information was presented for administrative ease when initially compiling the EB presentation after the change to one segment occurred. Such accounts were viewed in the aggregate by the CODM when assessing the Company’s performance against its recent business objectives, for example lowering days sales outstanding as much as possible at each reporting period, and reducing other cost of goods sold. The EB presentation no longer includes the break out of this information at this level.

The only other non-consolidated financial information discussed are the discrete summary financial results of recently acquired businesses (no longer including the Carve-Out business), which are separated so the CODM can monitor organic company performance against budget, guidance and analysts’ expectations that were set prior to, and therefore without considering the impact of, those acquired businesses. Limited financial results of a newly acquired business are compared to pre-acquisition forecasts to determine performance against those expectations while the business is undergoing operational consolidation into Mercury, typically for a period of one to two quarters.

Read in the reply
In its next report

First report after the company's reply of Feb 2, 2017: 10-Q filed Feb 9, 2017 ↗, against the 10-Q filed Nov 3, 2016 ↗.

Tickdelta does not hold the text of both reports, so they are not compared here.

Item 8. Financial Statements · Note P – Operating Segment, page 74
SEC asked (2)
From your response, it appears that you have segment managers who are held accountable for MCE, MDS, and the Carve-Out business. Please identify and describe the role of each of your segment managers and explain to us the title and role of the person to whom your segment mangers report.
MRCY answered
Mercury’s Response to Comment 2: The COO, who reports directly to the CEO (CODM), is the segment manager who is held accountable for MCE, MDS and Carve-Out business reporting units. Although discrete financial information for these reporting units is compiled, it is not prepared for, presented, or reviewed in the EB meeting, and is not used by the CODM in in assessing performance and allocating resources.
Rest of the answer

Again, the CODM uses only consolidated total Mercury-wide results to make business decisions in the EB meeting and other decision making forums.

For purposes of goodwill impairment testing, each of the three aforementioned business components meets the definition of a reporting unit under ASC 350, Intangibles – Goodwill and Other, because: (i) discrete financial information is available, and (ii) the segment manager (COO) reviews the three components’ operating results. Additionally, ASC 280-10-50-7 states that “a segment manager…is directly accountable to and maintains regular contact with the chief operating decision maker to discuss operating activities, financial results, forecasts, or plans for the segment.” At Mercury, our CEO (CODM) reviews the results of our one operating segment, while our segment manager (COO) reviews the results of the three reporting units.

It is important to note that, while the COO reviews the results of the three reporting units individually, the COO is held accountable by the CEO (CODM) for the business components in the aggregate. The COO’s review of the discrete financial information of the individual reporting units is performed to carry out the strategic directives of the CEO (CODM). It is also important to note that the COO’s accountability is limited to the engineering, manufacturing and sales functions. All other functions, as noted above, are managed by the CEO’s (CODM’s) other direct reports. The COO’s role also includes the execution of certain tactical initiatives in support of strategic objectives and operational initiatives defined by the CEO (CODM), but the COO does not dictate the strategic objectives or operational initiatives of the Company.

Read in the reply
In its next report

First report after the company's reply of Feb 2, 2017: 10-Q filed Feb 9, 2017 ↗, against the 10-Q filed Nov 3, 2016 ↗.

Tickdelta does not hold the text of both reports, so they are not compared here.

Item 8. Financial Statements · Note P – Operating Segment, page 74
SEC asked (3)
With respect to your budgets, please explain how budgets are prepared, who approves the budget at each step of the process, the level of detail discussed at each step, and the level at which the CODM makes changes to the budget. Also describe the level of detail communicated to the CODM when actual results differ from budgets and who is involved in meetings with the CODM to discuss budget-to-actual variances.
MRCY answered
Mercury’s Response to Comment 3: Budget preparation starts with a top-down total Company set of objectives for growth and profitability set by the CEO (CODM), followed by a bottom-up bookings and revenue plan by customer and secondarily by program, which is led by the corporate sales function in coordination with the corporate FP&A function under the CFO, with input from the customer strategic account managers and product technology general managers. The bookings plan is then translated into a revenue plan by customer and program.
Rest of the answer

The bookings and revenue plans are reviewed and discussed initially between the COO and sales management, and product technology lines determine the direct margin by program and other cost of goods sold by plant. Product technology GM’s review their plans with the COO. Operating expense budgets are based on the Company’s high level target business model objectives, which are translated into targets by product technology line and by function with inputs from the executive leader of each functional area. These elements are then combined into a preliminary total Company revenue and cost plan that is reviewed with the CFO and the COO. These initial results are then presented to the CEO (CODM) where the final high level total Company target revenue, gross margin and profitability objectives are determined by the CEO (CODM) in the context of the Company’s high-level target business model, and re-allocation of resources and funding may result. Based on these determinations, all subsequent product technology, corporate and departmental spending is then driven down into functional areas.

The final budget, within the financial and operational directives determined by our CEO (CODM) is submitted for approval by our board of directors (“BOD”). The end-to-end process described above may go through multiple iterations before the final SOP or budget is presented to and approved by the BOD.

Budget-to-actual variances are communicated to the CEO (CODM) at the monthly EB meetings on a total Company basis. These consolidated budget-to-actual variances include bookings, revenue, gross margin, operating expenses by line item and taxes. Variances, both negative and positive, are used by the CEO (CODM) to adjust priorities, spending and resource allocations for the total Company throughout the year, and such adjustments are administered by the functional executives.

****

The Company hereby acknowledges the following:

the Company is responsible for the adequacy and accuracy of the disclosure in the filing;

the Staff comments or changes to disclosure in response to Staff comments do not foreclose the Commission from taking any action with respect to the filing; and the Company may not assert Staff comments as a defense in any proceeding initiated by the Commission or any person under the federal securities laws of the United States.

If the Staff has any questions, additional comments or wishes to discuss the responses provided above at any time, please do not hesitate to contact me at (978) 967-1990, or Charles A. Speicher, Vice President, Controller and Chief Accounting Officer at (978) 967-1737.

Read in the reply
In its next report

First report after the company's reply of Feb 2, 2017: 10-Q filed Feb 9, 2017 ↗, against the 10-Q filed Nov 3, 2016 ↗.

Tickdelta does not hold the text of both reports, so they are not compared here.

Item 8. Financial Statements · Note P – Operating Segment, page 74
SEC asked (1)
We note from your response to comment 3 in our letter dated January 5, 2017 that the financial information used by your CODM includes revenue and bookings by product lines. Please revise future filings to disclose the revenues by product or for each group of similar products as required by ASC 280-10-50-40.
MRCY answered
Mercury’s Response to Comment 1: In accordance with the Staff’s comment, in future filings, the Company will enhance its disclosures related to revenues by product or for each group of similar products as required by ASC 280-10-50-40.
Read in the reply
In its next report

First report after the company's reply of Feb 23, 2017: 10-Q filed May 4, 2017 ↗, against the 10-Q filed Nov 3, 2016 ↗.

Tickdelta does not hold the text of both reports, so they are not compared here.

Exhibit 99.1
SEC asked (2)
We note that your discussion of adjusted EBITDA on page 1 omits a discussion of the comparable GAAP measure. In your next earnings release please present the most directly comparable GAAP measure with equal or greater prominence. Refer to the guidance of Question 102.10 of the updated Compliance and Disclosure Interpretation Guidance on non-GAAP financial measures issued on May 17, 2016.
MRCY answered
Mercury’s Response to Comment 2: In accordance with the Staff’s comment, in future filings, the Company will present GAAP measures with equal or greater prominence where non-GAAP measures are also presented.
Read in the reply
In its next report

First report after the company's reply of Feb 23, 2017: 10-Q filed May 4, 2017 ↗, against the 10-Q filed Nov 3, 2016 ↗.

Tickdelta does not hold the text of both reports, so they are not compared here.

Exhibit 99.1
SEC asked (3)
We note that you have presented revenues excluding the impact of CES and net income excluding the impact of CES, which are non-GAAP measures. Please revise future filings to identify the measures as non-GAAP and to provide the disclosures required by Item 10(e)(1) of Regulation S-K. You may also consider disclosing only the impact of CES acquisition on your revenues and net income.
MRCY answered
Mercury’s Response to Comment 3: In accordance with the Staff’s comment, in future filings the Company will enhance its disclosures related to any newly acquired businesses and discuss in the Non-GAAP Financial Measures section as required.

****

The Company hereby acknowledges the following:

• the Company is responsible for the adequacy and accuracy of the disclosure in the filing;

the Staff comments or changes to disclosure in response to Staff comments do not foreclose the Commission from taking any action with respect to the filing; and the Company may not assert Staff comments as a
Rest of the answer

defense in any proceeding initiated by the Commission or any person under the federal securities laws of the United States.

If the Staff has any questions, additional comments or wishes to discuss the responses provided above at any time, please do not hesitate to contact me at (978) 967-1990, or Charles A. Speicher, Vice President, Controller and Chief Accounting Officer at (978) 967-1737.

Read in the reply
In its next report

First report after the company's reply of Feb 23, 2017: 10-Q filed May 4, 2017 ↗, against the 10-Q filed Nov 3, 2016 ↗.

Tickdelta does not hold the text of both reports, so they are not compared here.

Also in this review: closing letter, 2017-03-01

From the SEC's correspondence on EDGAR: staff letters (form UPLOAD) and company letters (form CORRESP), 13 letters filed since 2017-01-05. Questions and answers are matched by their numbers; topics come from words in each question. The reports are compared word for word (same form, before the first SEC letter against the first report after the company's reply). No AI.

Sources

The SEC's correspondence on EDGAR: staff letters (form UPLOAD) and company letters (form CORRESP), matched question by question. No AI.

Also

Filings: the letters in the filing list.

Work with it

Excel workbook · CSV. Google Sheet that stays up to date: paste =IMPORTDATA("https://tickdelta.com/company/MRCY/export.csv") into a cell.

Next in Owners and insiders:Insider trades
Esc

Type a ticker such as AAPL, a name, an investor such as Buffett, or a topic such as tariffs. ↑ ↓ to move, Enter to open.