Power Integrations Inc POWI
We design, develop and market analog and mixed-signal integrated circuits (“ICs”) and other electronic components and circuitry used in high-voltage power conversion. 10-K, Item 1
- Headquarters
- San Jose, CA
- CEO
- Jennifer A. Lloyd
- Next results
- around Feb 4, 2027
Where each dollar of revenue went, FY2025
Revenue of $443.5M through the costs to a net profit of $22.1M · income statement of the 10-K
POWI among Technology peers
Six ratios from the latest 10-K. Each corner is the share of 230 peers the company is above, not a score.
What changed
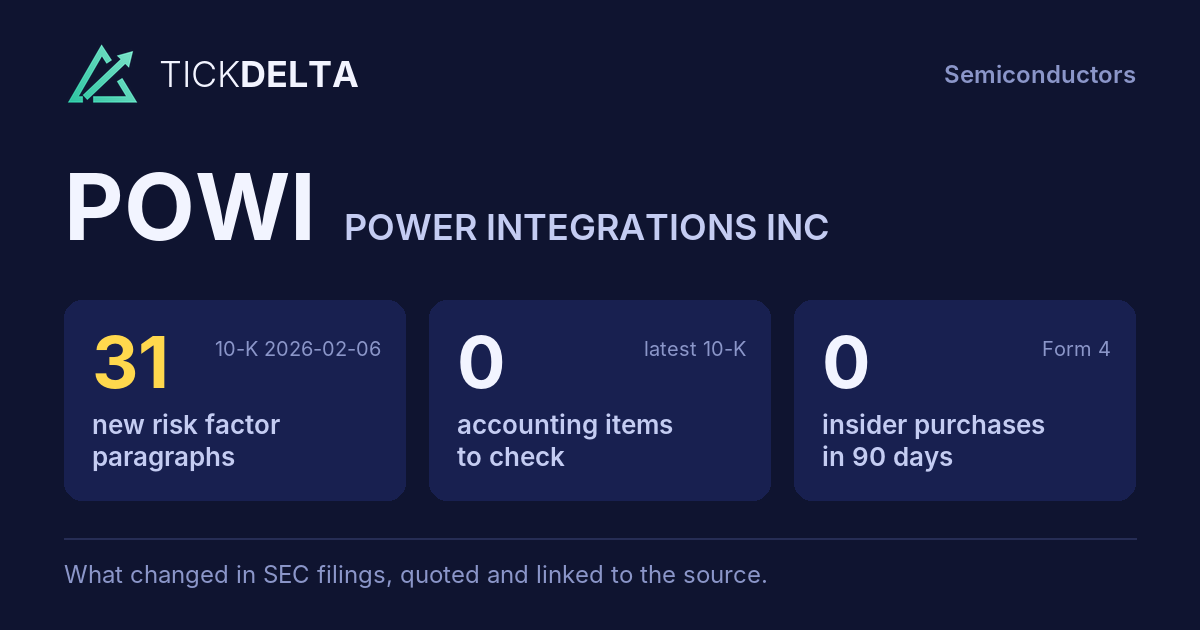
31 new risk paragraphs. 10-K filed Feb 6, 2026 against Feb 7, 2025.
Each row opens the detail with the quote and the filing. A row is a change worth reading, not a verdict.
Accounting checks
11 checks on the latest 10-K. Checks, not verdicts.
0facts worth reading about all 11 checks found nothing to note
-
Receivables -32.8% ($27.2M to $18.3M) vs revenue +5.9% ($419.0M to $443.5M), -38.7 pts apart
-
Cash from operations $111.5M vs net income $22.1M (FY ending Dec 31, 2025)
-
Inventory +0.8% ($165.6M to $166.9M) vs revenue +5.9% ($419.0M to $443.5M), -5.1 pts apart
8 more checks with nothing to note
-
Same auditor in both 10-Ks: DELOITTE & TOUCHE LLP
-
No statement of substantial doubt about going concern
-
No 8-K item 4.02 in the last 2 years
-
No NT 10-K or NT 10-Q in the last 2 years
-
The same matters as last year: Inventories - Provision for Excess and Obsolete Inventory
-
No sentence in the 10-K concludes that controls were not effective because of a material weakness
-
No 8-K item 2.06 in the last 2 years
-
No 8-K item 1.03 in the last 2 years
In their words
31 paragraphs in Risk Factors that were not in the 10-K filed Feb 7, 2025. Quoted as filed.
-
Item 1A · new paragraph · not in the 10-K filed Feb 7, 2025 10-K, ITEM 1A
Investing in our common stock involves a high degree of risk. You should carefully consider the risks and uncertainties described below, together with all of the other information in this Annual Report on Form 10-K, including the section titled “Management’s Discussion and Analysis of Financial Condition and Results of Operations” and…
-
Item 1A · new paragraph · not in the 10-K filed Feb 7, 2025 10-K, ITEM 1A
Changes in global trade, in particular the escalation and imposition of new and higher tariffs and additional export controls, could reduce demand for end products that incorporate our products, which could have a material adverse effect on our revenue and operating results. Further, increased tariffs or the imposition of other barriers…
-
Item 1A · new paragraph · not in the 10-K filed Feb 7, 2025 10-K, ITEM 1A
Unfavorable or uncertain market conditions and risks relating to the adoption, use or application of emerging technologies, including AI, by our customers and in our business, may impact financial results and could result in reputational and financial harm and liability. The adoption of AI solutions and other emerging technologies may…
-
Item 1A · new paragraph · not in the 10-K filed Feb 7, 2025 10-K, ITEM 1A
Additionally, we compete with major domestic and international semiconductor companies, many of which have greater market recognition and substantially greater financial, technical, marketing, distribution and other resources than we do. In addition, some governments, such as China, may provide, or have provided and may continue to…
New risk paragraphs, against peers
Latest 10-K of each, Technology companies closest in revenue
Paragraphs in Risk Factors with nothing like them in the company's 10-K the year before. A count of text, not of risk.
Financial performance
Last 4 fiscal years · 10-K XBRL
| Metric | FY2022 | FY2023 | FY2024 | FY2025 |
|---|---|---|---|---|
| Revenue | $651.1M | $444.5M | $419.0M | $443.5M |
| Net income | $170.9M | $55.7M | $32.2M | $22.1M |
| Operating cash flow | $215.3M | $65.8M | $81.2M | $111.5M |
| Free cash flow | $176.1M | $44.9M | $63.9M | $87.1M |
Revenue, FY2016 to FY2025
Ten fiscal years, each from its own 10-K · XBRL · USD
$443.5M ▲ 5.9% in FY2025$22.1M ▼ 31.5% in FY2025$87.1M ▲ 36.4% in FY2025
Recent filings
3 filings in the last 30 days · SEC EDGAR
-
Planned saleNov 5, 2026Wendy A. Arienzo (member of our Board of Directors) adopted a 10b5-1 trading plan reported in the 10-Q, up to 16,391 shares, runs to Aug 12, 2027
-
10-QNov 5, 2026Quarterly report (10-Q) period ended Sep 30, 2026
-
8-KNov 4, 2026Quarterly results 8-K item 2.02
About the company
Power Integrations Inc, San Jose, CA · from the 10-K filed Feb 6, 2026
We design, develop and market analog and mixed-signal integrated circuits (“ICs”) and other electronic components and circuitry used in high-voltage power conversion. Our products are used in power converters that convert electricity from a high-voltage source to the type of power required for a specified downstream use. In most cases, this conversion entails, among other functions, converting alternating current (“AC”) to direct current (“DC”) or vice versa, reducing or increasing the voltage, and regulating the output voltage and/or current according to the customer’s specifications.
- Headquarters
- San Jose, CA
- Country
- United States
- Reports in
- USD
- Listed on
- Nasdaq
- Fiscal year ends
- December 31
- Last results
- Nov 4, 2026
- Incorporated in
- CA
Email alerts
Sources
The 10-K filed Feb 6, 2026 (open at SEC), compared with the 10-K filed Feb 7, 2025. Numbers from the XBRL of the 10-Ks; filings from SEC EDGAR.
Work with it: Excel workbook · CSV. Google Sheet that stays up to date: paste =IMPORTDATA("https://tickdelta.com/company/POWI/export.csv") into a cell.