ZoomInfo Technologies Inc. GTM
ZoomInfo is a global leader in modern go-to-market software, data, and intelligence for sales, marketing, operations, and recruiting teams. 10-K, Item 1
- Employees
- 3,180
- Headquarters
- Vancouver, WA
- CEO
- Henry Schuck
- Next results
- around Feb 8, 2027
Where each dollar of revenue went, FY2025
Revenue of $1.2B through the costs to a net profit of $124.2M · income statement of the 10-K
GTM among Technology peers
Six ratios from the latest 10-K. Each corner is the share of 230 peers the company is above, not a score.
What changed
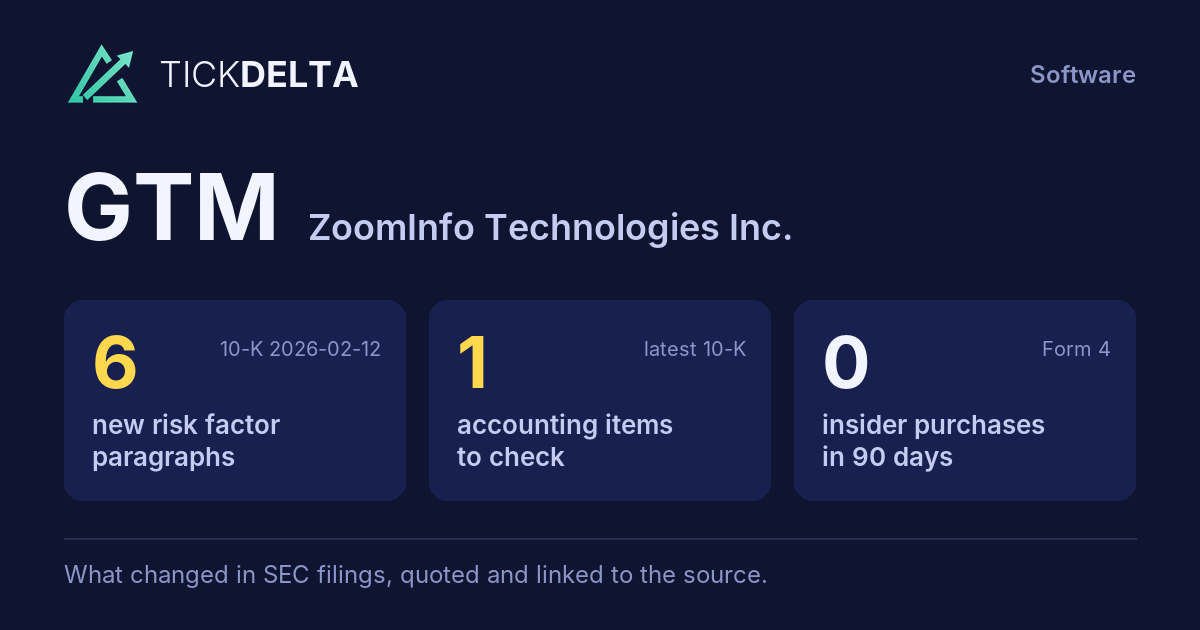
6 new risk paragraphs and 1 accounting fact worth reading about. 10-K filed Feb 12, 2026 against Feb 25, 2025.
Each row opens the detail with the quote and the filing. A row is a change worth reading, not a verdict.
Accounting checks
10 checks on the latest 10-K. Checks, not verdicts.
1fact worth reading about the other 9 checks found nothing to note
-
Critical audit matters changedNew this year: Table of Content s. Same as last year: Evaluation of the realizability of deferred tax assets
-
Receivables -8.3% ($246.1M to $225.6M) vs revenue +2.9% ($1.2B to $1.2B), -11.2 pts apart
8 more checks with nothing to note
-
Cash from operations $465.4M vs net income $124.2M (FY ending Dec 31, 2025)
-
Same auditor in both 10-Ks: KPMG LLP
-
No statement of substantial doubt about going concern
-
No 8-K item 4.02 in the last 2 years
-
No NT 10-K or NT 10-Q in the last 2 years
-
No sentence in the 10-K concludes that controls were not effective because of a material weakness
-
No 8-K item 2.06 in the last 2 years
-
No 8-K item 1.03 in the last 2 years
In their words
6 paragraphs in Risk Factors that were not in the 10-K filed Feb 25, 2025. Quoted as filed.
-
Item 1A · new paragraph · not in the 10-K filed Feb 25, 2025 10-K, ITEM 1A
In addition, existing and potential competitors in our industry may be able to offer more flexible pricing models that better align with the actual usage and realized value obtained by customers, including pay-as-you-go models or other bespoke pricing packages, that may be more desirable for small and mid-market customers who are more…
-
Item 1A · new paragraph · not in the 10-K filed Feb 25, 2025 10-K, ITEM 1A
In addition, the rapid advancement and widespread adoption of LLMs and generative AI technologies could result in new competitors in our industry. Prominent LLM providers and other leading generative AI companies, are developing increasingly sophisticated AI capabilities, and such technologies may incorporate business contact…
-
Item 1A · new paragraph · not in the 10-K filed Feb 25, 2025 10-K, ITEM 1A
In addition, in order to maintain our market-leading position in AI-driven go-to-market products and services, we have invested, and will continue to invest, in the AI-capabilities of our workforce. As a result of this strategy, we have made substantial capital investments and have committed significant resources, including engineering…
-
Item 1A · new paragraph · not in the 10-K filed Feb 25, 2025 10-K, ITEM 1A
In addition, in recent years, customer behavior and traffic acquisition dynamics have shifted, and may continue to shift, due to the increasing adoption of AI-powered search experiences and LLM models that provide responses without directing users to third-party websites, which could reduce click-through rates and materially diminish…
New risk paragraphs, against peers
Latest 10-K of each, Technology companies closest in revenue
Paragraphs in Risk Factors with nothing like them in the company's 10-K the year before. A count of text, not of risk.
Financial performance
Last 4 fiscal years · 10-K XBRL
| Metric | FY2022 | FY2023 | FY2024 | FY2025 |
|---|---|---|---|---|
| Revenue | $1.1B | $1.2B | $1.2B | $1.2B |
| Net income | $63.2M | $107.3M | $29.1M | $124.2M |
| Operating cash flow | $417.0M | $434.9M | $369.4M | $465.4M |
| Free cash flow | $388.1M | $408.4M | $304.5M | $389.3M |
Revenue, FY2018 to FY2025
Ten fiscal years, each from its own 10-K · XBRL · USD
$1.2B ▲ 2.9% in FY2025$124.2M ▲ 326.8% in FY2025$389.3M ▲ 27.8% in FY2025
Recent filings
5 filings in the last 30 days · SEC EDGAR
-
Planned saleNov 4, 2026James Roth (Chief Revenue Officer) adopted a 10b5-1 trading plan reported in the 10-Q, up to 305,029 shares, runs to Dec 31, 2027
-
8-KNov 4, 2026Quarterly results 8-K item 2.02
-
10-QNov 4, 2026Quarterly report (10-Q) period ended Sep 30, 2026
-
Planned saleNov 3, 2026ASHLEY MCGRANE (Officer) gave notice of a planned sale of 773 shares worth about $3K Form 144, approximate sale date Nov 3, 2026, under a 10b5-1 plan adopted Dec 12, 2025
-
8-KOct 19, 2026Material agreement signed 8-K item 1.01
About the company
ZoomInfo Technologies Inc., Vancouver, WA · from the 10-K filed Feb 12, 2026
ZoomInfo is a global leader in modern go-to-market software, data, and intelligence for sales, marketing, operations, and recruiting teams. Our go-to-market intelligence platform empowers businesses with AI-ready insights, trusted data, agent-assisted selling and advanced automation providing sales, marketing, operations, and recruiting professionals accurate information and insights on the organizations and professionals they target. This enables our customers to shorten sales cycles and increase win rates by empowering sellers, marketers, and recruiters to efficiently deliver the right message to the right person at the right time in the right way.
- Headquarters
- Vancouver, WA
- Country
- United States
- Reports in
- USD
- Listed on
- Nasdaq
- Fiscal year ends
- December 31
- Last results
- Nov 4, 2026
- Incorporated in
- DE
Employees, at the top of the page: "As of December 31, 2025, we had 3,180 employees, consisting of 662 in cost of service, 1,370 in sales and marketing, 763 in research and development, and 385 in general and administrative" (10-K). Address and exchange: SEC's company file.
Email alerts
Sources
The 10-K filed Feb 12, 2026 (open at SEC), compared with the 10-K filed Feb 25, 2025. Numbers from the XBRL of the 10-Ks; filings from SEC EDGAR.
Work with it: Excel workbook · CSV. Google Sheet that stays up to date: paste =IMPORTDATA("https://tickdelta.com/company/GTM/export.csv") into a cell.