JBT MAREL Corp JBTM
We are a leading and diversified global technology solutions and service provider to high-value segments of the food and beverage industry. 10-K, Item 1
- Employees
- 11,500
- Headquarters
- Chicago, IL
- CEO
- Brian A. Deck
- Next results
- around Feb 22, 2027
Where each dollar of revenue went, FY2024
Revenue of $1.7B through the costs to a net profit of $85.4M · income statement of the 10-K
JBTM among Industrials peers
Six ratios from the latest 10-K. Each corner is the share of 251 peers the company is above, not a score.
What changed
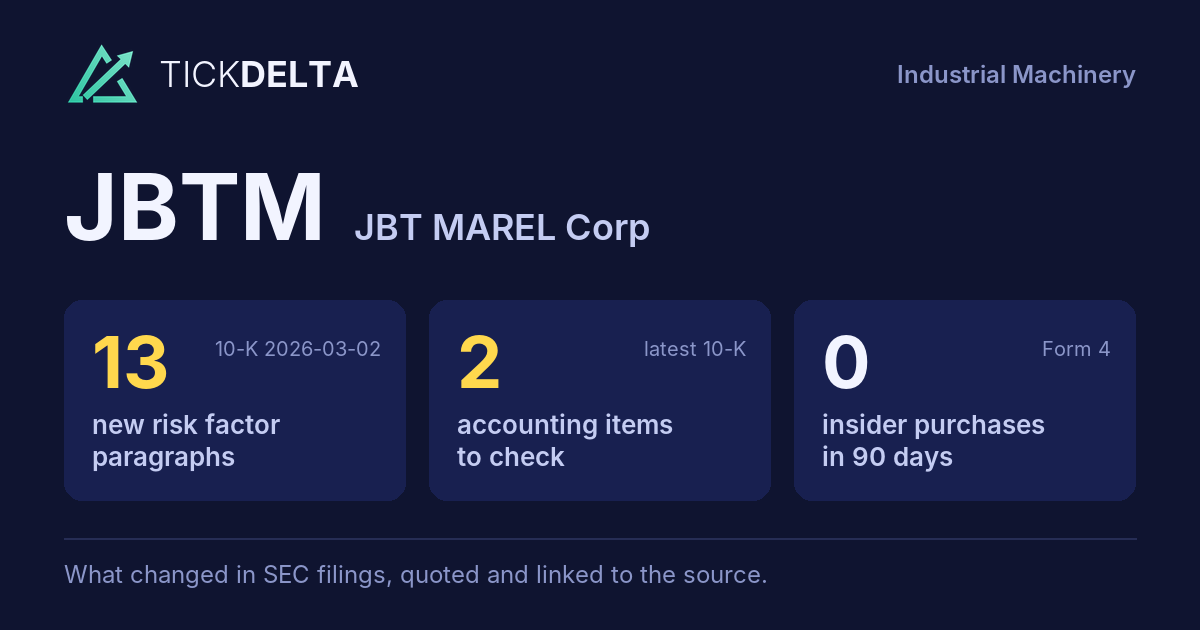
13 new risk paragraphs and 2 accounting facts worth reading about. 10-K filed Mar 2, 2026 against Feb 28, 2025.
Each row opens the detail with the quote and the filing. A row is a change worth reading, not a verdict.
Accounting checks
11 checks on the latest 10-K. Checks, not verdicts.
2facts worth reading about the other 9 checks found nothing to note
-
Inventory growing faster than revenueInventory +176.1% ($233.1M to $643.7M) vs revenue +121.3% ($1.7B to $3.8B), +54.8 pts apart
-
Critical audit matters changedNew this year: Acquisition of Marel - Valuation of Customer Relationships, Trademarks, and Acquired Technology (“As described in Note 2 to the consolidated financial statements, on January 2, 2025, the Company acquired 97.5% of the equity interests of Marel for $4,182.3 million, which is net of cash acquired of $90.0 million. On February 4, 2025, the Company acquired the remaining 2.5% of Marel’s equity intere”). Same as last year: Revenue Recognition - Product Revenue Estimated Costs at Completion
-
Receivables +84.8% ($239.7M to $442.9M) vs revenue +121.3% ($1.7B to $3.8B), -36.6 pts apart
8 more checks with nothing to note
-
Cash from operations $341.7M vs net income −$50.5M (FY ending Dec 31, 2025)
-
Same auditor in both 10-Ks: PricewaterhouseCoopers LLP
-
No statement of substantial doubt about going concern
-
No 8-K item 4.02 in the last 2 years
-
No NT 10-K or NT 10-Q in the last 2 years
-
No sentence in the 10-K concludes that controls were not effective because of a material weakness
-
No 8-K item 2.06 in the last 2 years
-
No 8-K item 1.03 in the last 2 years
In their words
13 paragraphs in Risk Factors that were not in the 10-K filed Feb 28, 2025. Quoted as filed.
-
Item 1A · new paragraph · not in the 10-K filed Feb 28, 2025 10-K, ITEM 1A
Material weaknesses were identified in Marel’s internal control over financial reporting and we may identify additional material weaknesses in the future or fail to maintain an effective system of internal control over financial reporting, which could result in material misstatements of Marel’s accounts and disclosures.
-
Item 1A · new paragraph · not in the 10-K filed Feb 28, 2025 10-K, ITEM 1A
As discussed in Item 9A., prior to the acquisition of Marel, its management identified two material weaknesses in its internal control over financial reporting, which remained unremediated as of December 31, 2025. Specifically, its management identified that 1) Marel did not design and maintain effective information technology general…
-
Item 1A · new paragraph · not in the 10-K filed Feb 28, 2025 10-K, ITEM 1A
In addition, our customers’ operations are subject to extensive regulations, including those that relate to animal welfare, food safety, and the processing, packaging, and storage of food products. These regulations could become more restrictive, which could lead to increased costs for our customers, or could require our customers to…
-
Item 1A · new paragraph · not in the 10-K filed Feb 28, 2025 10-K, ITEM 1A
Our business has been, and may continue to be, adversely affected by tariffs, trade sanctions or similar government actions, as well as overall uncertainty surrounding international trade relations. Our operations in various countries and jurisdictions subject us to the legal, political, regulatory, and social requirements and economic…
New risk paragraphs, against peers
Latest 10-K of each, Industrials companies closest in revenue
Paragraphs in Risk Factors with nothing like them in the company's 10-K the year before. A count of text, not of risk.
Financial performance
Last 4 fiscal years · 10-K XBRL
| Metric | FY2022 | FY2023 | FY2024 | FY2025 |
|---|---|---|---|---|
| Revenue | $1.6B | $1.7B | $1.7B | $3.8B |
| Net income | $137.4M | $582.6M | $85.4M | −$50.5M |
| Operating cash flow | $142.3M | $74.2M | $232.6M | $341.7M |
| Free cash flow | $57.7M | $19.1M | $194.7M | $238.1M |
Revenue, FY2016 to FY2025
Ten fiscal years, each from its own 10-K · XBRL · USD
$3.8B ▲ 121.3% in FY2025−$50.5M in FY2025$238.1M ▲ 22.3% in FY2025
Recent filings
2 filings in the last 30 days · SEC EDGAR
-
8-KNov 3, 2026Quarterly results 8-K item 2.02
-
10-QNov 3, 2026Quarterly report (10-Q) period ended Sep 30, 2026
About the company
JBT MAREL Corp, Chicago, IL · from the 10-K filed Mar 2, 2026
We are a leading and diversified global technology solutions and service provider to high-value segments of the food and beverage industry. We design, produce, and service sophisticated products and systems for multi-national and regional customers. Our purpose is to transform the future of food by providing solutions that substantially enhance our customers’ success, and in doing so design, produce and service sophisticated and critical products and systems for food and beverage companies that increase yields, boost efficiency, and improve food safety.
- Headquarters
- Chicago, IL
- Country
- United States
- Reports in
- USD
- Listed on
- NYSE
- Fiscal year ends
- December 31
- Last results
- Nov 3, 2026
- Incorporated in
- DE
Employees, at the top of the page: "As of December 31, 2025, we employed approximately 11,500 people worldwide, with approximately 27% located in the United States" (10-K). Address and exchange: SEC's company file.
Email alerts
Sources
The 10-K filed Mar 2, 2026 (open at SEC), compared with the 10-K filed Feb 28, 2025. Numbers from the XBRL of the 10-Ks; filings from SEC EDGAR.
Work with it: Excel workbook · CSV. Google Sheet that stays up to date: paste =IMPORTDATA("https://tickdelta.com/company/JBTM/export.csv") into a cell.