Enphase Energy, Inc. ENPH
We are a global energy technology company originally founded in March 2006. 10-K, Item 1
- Employees
- 2,872
- Headquarters
- Fremont, CA
- CEO
- Badrinarayanan Kothandaraman
- Next results
- around Feb 2, 2027
Where each dollar of revenue went, FY2025
Revenue of $1.5B through the costs to a net profit of $172.1M · income statement of the 10-K
ENPH among Technology peers
Six ratios from the latest 10-K. Each corner is the share of 230 peers the company is above, not a score.
What changed
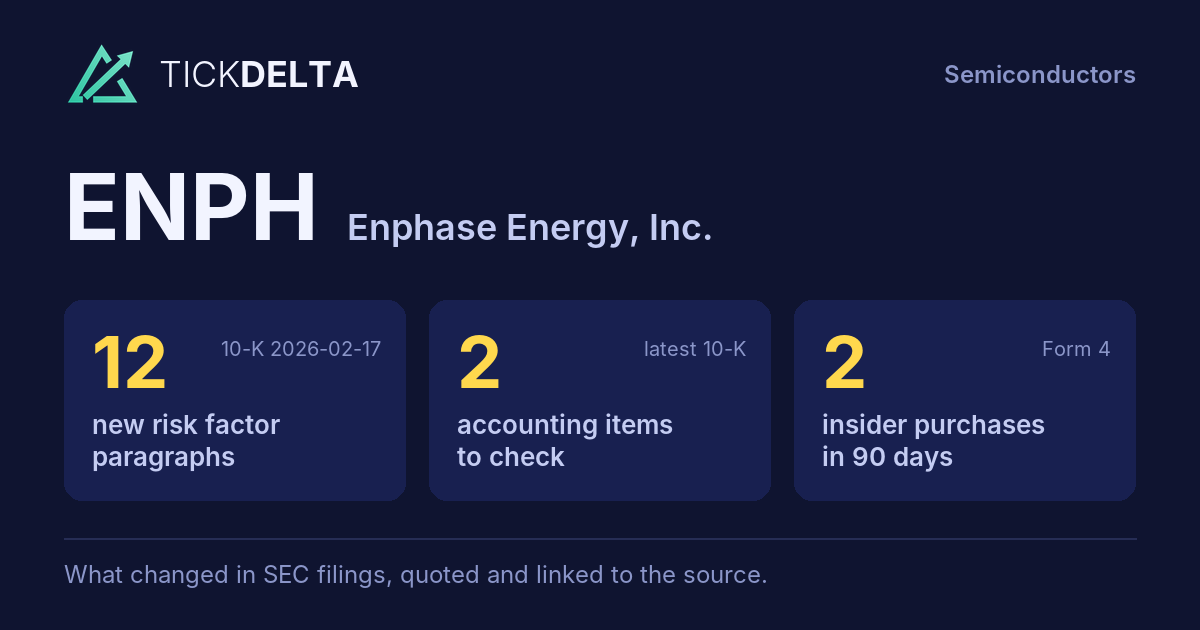
12 new risk paragraphs and 2 accounting facts worth reading about. 10-K filed Feb 17, 2026 against Feb 10, 2025.
Each row opens the detail with the quote and the filing. A row is a change worth reading, not a verdict.
Accounting checks
11 checks on the latest 10-K. Checks, not verdicts.
2facts worth reading about the other 9 checks found nothing to note
-
Cash from operations lower than net incomeCash from operations $136.5M vs net income $172.1M (FY ending Dec 31, 2025)
-
Inventory growing faster than revenueInventory +74.6% ($165.0M to $288.0M) vs revenue +10.7% ($1.3B to $1.5B), +63.9 pts apart
-
Receivables +2.7% ($223.7M to $229.9M) vs revenue +10.7% ($1.3B to $1.5B), -8.0 pts apart
8 more checks with nothing to note
-
Same auditor in both 10-Ks: DELOITTE & TOUCHE LLP
-
No statement of substantial doubt about going concern
-
No 8-K item 4.02 in the last 2 years
-
No NT 10-K or NT 10-Q in the last 2 years
-
No longer listed: Table of Contents. Same as last year: Warranty Obligations
-
No sentence in the 10-K concludes that controls were not effective because of a material weakness
-
No 8-K item 2.06 in the last 2 years
-
No 8-K item 1.03 in the last 2 years
In their words
12 paragraphs in Risk Factors that were not in the 10-K filed Feb 10, 2025. Quoted as filed.
-
Item 1A · new paragraph · not in the 10-K filed Feb 10, 2025 10-K, ITEM 1A
Our business and the broader solar and energy storage industry depend significantly on government-issued subsidies and economic incentives that promote the adoption and cost competitiveness of solar photovoltaic (“PV”) and energy storage systems for on-grid applications. These incentives include, among others, ITCs, feed-in tariffs…
-
Item 1A · new paragraph · not in the 10-K filed Feb 10, 2025 10-K, ITEM 1A
The inability of our products to comply with the minimum domestic content tax credit thresholds, inclusive of FEOC regulations, could negatively impact our business, financial condition and results of operations. Recent legislative and regulatory changes, including those introduced under the OBBBA and related executive actions, impose…
-
Item 1A · new paragraph · not in the 10-K filed Feb 10, 2025 10-K, ITEM 1A
The United States has imposed significant new tariffs on nearly all products and components imported into the United States and could propose additional tariffs or increases to those already in place. A subset of our products is sourced from China and India, and certain components necessary to manufacture our products in the United…
-
Item 1A · new paragraph · not in the 10-K filed Feb 10, 2025 10-K, ITEM 1A
Trade disputes, trade restrictions, tariffs and other geopolitical tensions between the United States and other countries may also exacerbate unfavorable macroeconomic conditions including inflationary pressures, foreign exchange volatility, financial market instability, and economic recessions or downturns, which may also negatively…
New risk paragraphs, against peers
Latest 10-K of each, Technology companies closest in revenue
Paragraphs in Risk Factors with nothing like them in the company's 10-K the year before. A count of text, not of risk.
Financial performance
Last 4 fiscal years · 10-K XBRL
| Metric | FY2022 | FY2023 | FY2024 | FY2025 |
|---|---|---|---|---|
| Revenue | $2.3B | $2.3B | $1.3B | $1.5B |
| Net income | $397.4M | $438.9M | $102.7M | $172.1M |
| Operating cash flow | $744.8M | $696.8M | $513.7M | $136.5M |
| Free cash flow | $698.4M | $586.4M | $480.1M | $95.9M |
Revenue, FY2016 to FY2025
Ten fiscal years, each from its own 10-K · XBRL · USD
$1.5B ▲ 10.7% in FY2025$172.1M ▲ 67.7% in FY2025$95.9M ▼ 80.0% in FY2025
Recent filings
7 filings in the last 30 days · SEC EDGAR
-
Planned saleNov 9, 2026Rodgers Massey Revocable Living Trust (Director) gave notice of a planned sale of 300,000 shares worth about $8.8M Form 144, approximate sale date Nov 9, 2026
-
BuyNov 3, 2026Trivedi Shanker (Director) bought $31K open-market purchase on Nov 3, 2026
-
BuyNov 2, 2026Kothandaraman Badrinarayanan (President & CEO) bought $268K open-market purchase on Nov 2, 2026
-
8-KOct 29, 2026Other events 8-K item 8.01
-
Planned saleOct 27, 2026Mandy Yang (Executive Vice President and Chief Financial Officer) adopted a 10b5-1 trading plan reported in the 10-Q, up to 9,304 shares, runs to Dec 24, 2026
About the company
Enphase Energy, Inc., Fremont, CA · from the 10-K filed Feb 17, 2026
We are a global energy technology company originally founded in March 2006. We deliver smart, easy-to-use solutions that manage solar generation, storage and communication on one platform. Our intelligent microinverters work with virtually every solar panel made, and when paired with our smart technology, result in one of the industry’s best-performing clean energy systems. For the first time in the evolution of our centuries-old grid, people can get paid for the clean energy they produce and share with their communities, helping to build a new energy future that harnesses the sun.
- Headquarters
- Fremont, CA
- Country
- United States
- Reports in
- USD
- Listed on
- Nasdaq
- Fiscal year ends
- December 31
- Last results
- Oct 27, 2026
- Incorporated in
- DE
Employees, at the top of the page: "As of December 31, 2025, we had 2,872 full-time employees" (10-K). Address and exchange: SEC's company file.
Email alerts
Sources
The 10-K filed Feb 17, 2026 (open at SEC), compared with the 10-K filed Feb 10, 2025. Numbers from the XBRL of the 10-Ks; filings from SEC EDGAR.
Work with it: Excel workbook · CSV. Google Sheet that stays up to date: paste =IMPORTDATA("https://tickdelta.com/company/ENPH/export.csv") into a cell.